1 / 1

1471 2164 14 292 s3

Télécharger la présentation

1471 2164 14 292 s3

An Image/Link below is provided (as is) to download presentation Download Policy: Content on the Website is provided to you AS IS for your information and personal use and may not be sold / licensed / shared on other websites without getting consent from its author. Content is provided to you AS IS for your information and personal use only. Download presentation by click this link. While downloading, if for some reason you are not able to download a presentation, the publisher may have deleted the file from their server. During download, if you can't get a presentation, the file might be deleted by the publisher.

E N D

Presentation Transcript


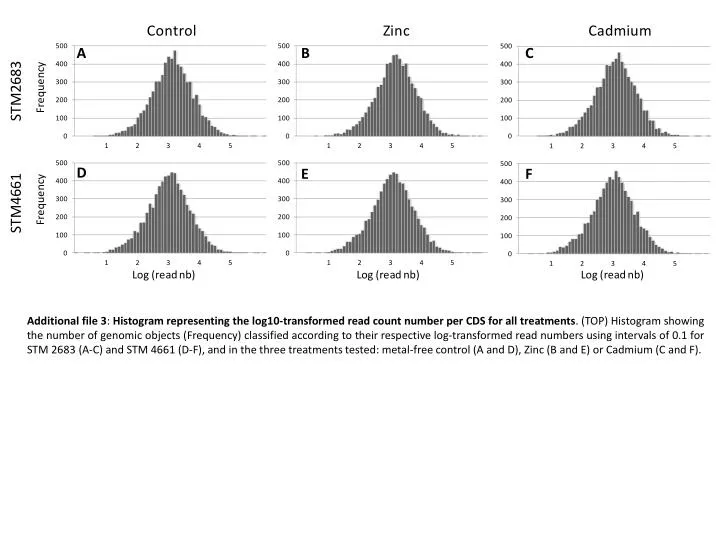
  1. Additional file 3: Histogram representing the log10-transformed read count number per CDS for all treatments. (TOP) Histogram showing the number of genomic objects (Frequency) classified according to their respective log-transformed read numbers using intervals of 0.1 for STM 2683 (A-C) and STM 4661 (D-F), and in the three treatments tested: metal-free control (A and D), Zinc (B and E) or Cadmium (C and F).

More Related