Download
1 / 63
630 likes | 791 Vues
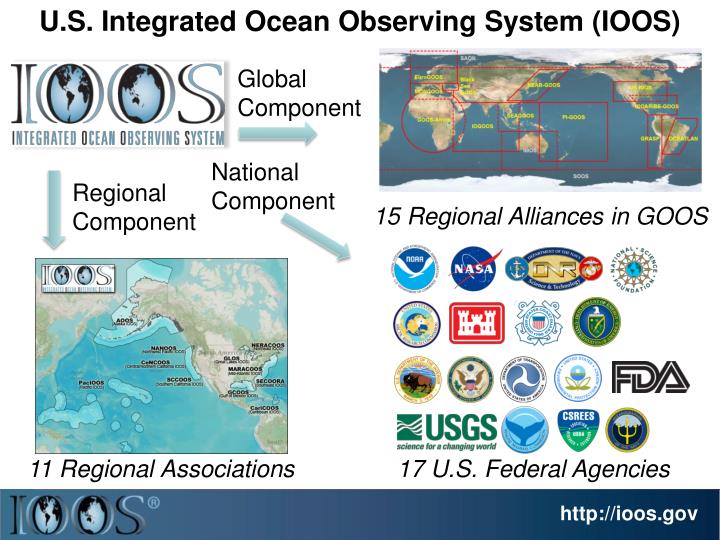
U.S. Integrated Ocean Observing System (IOOS). Global Component. National Component. Regional Component. 1 5 Regional Alliances in GOOS. Vessels - Satellite. Satellite. CODAR. Ships/ Vessels. Glider. REMUS. Data Vis. Modeling. Security. Leadership. Education.

E N D
U.S. Integrated Ocean Observing System (IOOS) Global Component National Component Regional Component 15 Regional Alliances in GOOS Vessels - Satellite Satellite CODAR Ships/ Vessels Glider REMUS Data Vis. Modeling Security Leadership Education 11 Regional Associations 17 U.S. Federal Agencies http://ioos.gov
RI U.. Middle Atlantic Regional Association Coastal Ocean Observing System 10 States -76 Million People 1000 km Cape to Cape CT Cape Cod MA NY PA NJ U.S. IOOS Responds to Hurricanes Irene and Sandy DE MD Sandy Irene >40 PIs >20 Institutions >50 Members >2000 Contacts Scott Glenn + Many VA NC Cape Hatteras
RI U.. Middle Atlantic Regional Association Coastal Ocean Observing System 10 States -76 Million People 1000 km Cape to Cape CT Cape Cod MA NY PA NJ U.S. IOOS Responds to Hurricanes Irene and Sandy DE MD Sandy Irene >40 PIs >20 Institutions >50 Members >2000 Contacts Scott Glenn + Many Hurricane Tuesday Group: Greg Seroka, Travis Miles, Yi Xu, Hugh Roarty, Josh Kohut, Oscar Schofield VA NC Cape Hatteras
Satellites HF-Radar Gliders Drifters Population Density To seek, discover & apply new knowledge & understanding of our coastal ocean Weather Stations Ocean Forecast Ensemble
Real-Time Satellite Ground Stations in the Northeast U.S. Satellites: NPP, Terra, Aqua, NOAA Polar Orbiters, Metop & GOES U. Maine City College of N.Y. Rutgers U. Delaware Johns Hopkins
Mid-Atlantic Bight HF Radar Network 1000 km Cape to Cape Mid-Atlantic HF Radar Network 16 Long-Range CODARs 8 Medium-Range CODARs 17 Short-Range CODARs 41 Total Triple Nested, Multi-static, Multi-use Industry Partner: CODAR Ocean Sensors
Mid-Atlantic Bight Glider Network RU01 RU15 RU29 G1 G1-Ruggedized G2 Satellite Ocean Color Satellite SST Subsurface Glider Data Industry Partner: Teledyne Webb Research
Improved Predictive Modeling and Data Assimilation 1) STPS U. Connecticut 4) HOPS U. Massachusetts, Dartmouth 2) NYHOPS Stevens Institute of Technology 3) ROMS Rutgers University
correlation Rutgers ROMS 4DVAR uses all available data from a modern coastal ocean observing system • more and diverse data is better (T, S, u, sea level) • bias correction to OBC and MDT is essential Useful subsurface skill for real-time applications: • 4 days for temperature and salinity; • 1-2 days for velocity Future directions: variational methods for observing system design; coupling; ecosystems Forward model Forward modelafter bias removal Data assimilationanalysis/hindcast Data used [… real-time SOURCE]*THREDDS Data Server • 72-hour forecast NAM 0Z cycle at 2 am EST [NCEP NOMADS] • RU regional CODAR hourly: 4-hour latency delay [RU TDS*] • RU glider T,S when available (~1 hour delay) [RU TDS] • USGS daily average flow available 11:00 EST [USGS waterdata] • AVHRR IR passes 6-8 per day (~ 2 hour delay) [MARACOOS TDS] • REMSS MW-IR blended SST daily average [NASA PO-DAAC] • HYCOM NCODA 7-day forecast updated daily [NRL] • Jason-2, CryoSat, AltiKaalong-track altimeter OGDR [RADS.nl] • SOOP XBT/CTD, Argo floats, on GTS [NOAA OSMC ERDDAP] 2-day forecast depth 4-day forecast Bottom temperature
MARACOOS Weather Network NDBC Backbone > 50 sites Regional Industry Enhancement > 100 sites
MARACOOS Weather Network NDBC Backbone > 50 sites • MARACOOS • Weather Ensemble • 3-7 Members • Verified with Coastal Observations
Advanced Research Version of WRF • Weather Research and Forecasting (WRF) model, Advanced Research core (ARW), Version 3.4.1 (Michalakes et al., 2001) • Horizontal Resolution: 6km • Vertical Resolution: 35 levels, focused near surface • Lateral B.C.: Global Forecast System (GFS) 0.5 degree • Microphysics:WRF Double-Moment 6-class scheme • Planetary Boundary Layer (PBL) scheme: YonseiUniversityscheme • Longwave radiation: Rapid Radiative Transfer Model (RRTMG) • Shortwave radiation: Dudhia • Bottom B.C. (Sea Surface Temperature, SST): Variant
MARACOOS Operations Center Rutgers University - Coastal Ocean Observation Lab Satellite Data Acquisition Stations CODAR Network Glider Fleet 3-D Forecasts
Hurricane Irene August 26, 2011 NOAA/NHC Damage: #8 with >$15 Billion. Track Accurate; Intensity Over-predicted. Hurricane Sandy October 29, 2012 NOAA/NHC Damage: #2 with >$60 Billion. Track Accurate; Intensity Under-predicted.
Hurricane Irene in the News: • Track accurately forecast days in advance. • Intensity was over-predicted. • Led to public skepticism.
National Hurricane Center:Track& Intensity Error Trends 20-Year Track Error Decreasing Long-term Intensity Error is Flat Track: Improvements attributed to Global Forecast Models & the Super-Ensemble. Intensity: “…upper-ocean thermal structure can affect the evolution of storm intensity, …Unfortunately, the paucity of subsurface measurements limits our ability to assess the effect of upper-ocean variability on tropical cyclone intensity evolution.” – Emanuel et al., (2004) Production Suite Review: December 4, 2012
Hurricane Irene: Track (August 2011) Historical Hurricane Tracks within 120 km of Atlantic City, NJ
Hurricane Irene 39.5N 73W Surface Current Time Series Total CurrentNear-Inertial Current Wave & Wind Direction Time Series Eye crosses NJ mid-day on Aug 28
Hurricane Irene Surface Current Wavelet Analysis Inertial Response Direct Wind Forcing Aug 27Aug 28Aug 29 Aug 30Aug 31Sep 01 Frontside Eye Backside Inertial Inertial Inertial
Sept 26 Real Time Global Sept 26 SST Difference Sept 26 Coldest Dark Pixel SST Before Irene Sept 31 SST Difference Sept 31 Real Time Global Sept 31 Coldest Dark Pixel SST After Irene
Hurricane Irene Glider Sampling • RU23 • Deployed for MARACOOS. • Map subsurface T/S structure for fisheries. • Damaged early - drifter • Recovered by fisherman • Provided data on inertial currents during storm. • RU16 • Deployed for EPA. • Map bottom dissolved oxygen. • Provided data on mixing during storm.
Hurricane Irene Glider Sampling Hurricane Irene 0 26 depth Temperature 14 55 0 33 depth • RU23 • Deployed for MARACOOS. • Map subsurface T/S structure for fisheries. • Damaged early - drifter • Recovered by fisherman • Provided data on inertial currents during storm. Salinity 29 55 0 105 • RU16 • Deployed for EPA. • Map bottom dissolved oxygen. • Provided data on mixing during storm. depth % Saturation (DO) 55 60 Aug 12 Sep 07
Before After Onshore Offshore
Hurricane Irene: Regional Ocean Modeling System ROMS Wind Stress = Pressure Grad. -------------------- Pressure Grad. = Coriolis Force Onshore Offshore Vertical Diffusion > Vertical Advection > Other Terms
Hurricane Irene: Regional Ocean Modeling System ROMS Wind Stress = Pressure Grad. -------------------- Pressure Grad. = Coriolis Force Onshore Offshore Vertical Diffusion > Vertical Advection > Other Terms
Sea Surface Temperature Difference (After – Before Irene) Real-Time MARACOOS Real-Time Global
Hurricane Irene: Spatial Distribution & Timing of Mixing & Cooling
Hurricane Irene: AWRF Atmospheric Forecast Sensitivity Study Warm SST Cold SST Hindcast Sensitivity Matrix
WRF Model Sensitivity Matrix 86 Model Runs to Date Initial Match-ups Largest Sensitivities to SST and Flux Coefficients.
Air-Sea Flux Options in WRF Ka= 2.4E-5 m2s-1 (background molecular viscosity) Re* = u*Z0 ⁄ν (Roughness Reynolds number), Pr = 0.71 (Prandtl number), Sc = 0.6 (Schmidt number) After Green & Zhang (2013) After Zhang et al. (2012) Presentation for HFIP
Maximum Wind Speed Eye over Mid-Atlantic Wind Speed Difference Top Sensitivities: SST Flux Coefficients Warm Flux Coefficients Cold
Max Wind Speed: Hindcast Sensitivities vs. NHC Best Track Operational Forecast GFS Model Guidance WRF with Ocean Mixed Layer
Hurricane Irene • August 26, 2011 • Strong Stratification • Limited storm surge • Mixing cooled surface • Limited intensity Hurricane Sandy October 29, 2012 NOAA/NHC Damage: #2 with >$60 Billion. Track Accurate; Intensity Under-predicted.
First Warning for Hurricane Sandy: Monday, Oct 22, 1-week prior to landfall IOOS Response: Prepare the Network
HF Radar Storm Damage HF Radar Shed floats 0.85 km across barrier island & river Keyport S I
Buoy Observations of Surface Winds Downwelling Favorable
Glider-derived Mixing Rb > 1 Stable Rb < 0.25 unstable 1 .25
Suspended Sediment Rb > 1 Stable Rb < 0.25 unstable 1 .25
Observatory-derived Cross-Shelf Force Balance Offshore Onshore Cross-Shelf Geostrophic Balance