Download

1 / 24
240 likes | 362 Vues
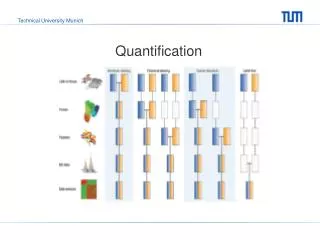
Advanced quantification in oncology PET. Irène Buvat IMNC – UMR 8165 CNRS – Paris 11 University Orsay, France buvat@imnc.in2p3.fr http://www.guillemet.org/irene. Two steps. Static imaging Dynamic imaging. Glucose metabolism Metabolically active tumor volume etc….

E N D
Advanced quantification in oncology PET Irène Buvat IMNC – UMR 8165 CNRS – Paris 11 University Orsay, France buvat@imnc.in2p3.fr http://www.guillemet.org/irene
Two steps Static imaging Dynamic imaging • Glucose metabolism • Metabolically active tumor volume • etc… Radiotracer concentration (kBq/mL)
Quantification issues in oncology PET • Tumor segmentation • Identification of indices that best characterize the tumor in a specific context • Interpretation of tumor changes during therapy • Understanding the relationship between macroscopic parameters (from PET images) and microscopic tumor features
Quantification issues in oncology PET • Tumor segmentation • Identification of indices that best characterize the tumor in a specific context • Interpretation of tumor changes during therapy • Understanding the relationship between macroscopic parameters (from PET images) and microscopic tumor features
Current quantification in oncology PET Tracer uptake (kBq/mL) SUV (Standardized Uptake Value) = Tracer uptake Injected activity / patient weight SUV ~ metabolic activity of tumor cells
SUV=10 SUV=5 SUV=5 SUV=2 Comparing 2 PET scans : current approach PET1 PET2 ~12 weeks • Need to identify and possibly delineate the tumors • Each tumor = 1 single SUV • Change compared to an empitical threshold (provided in recommendations such as EORTC, PERCIST) • Tedious when there are many tumor sites
A novel parametric imaging approach Goal : Get an objective voxel-based comparison of 2 PET/CT scans PET1 PET2 ~ 12 weeks
2. Voxel-based subtraction of the 2 image volumes PET1-PET2’ PET1 PET2 3. Identification of voxels in which SUV significantly changed between the 2 scans using a biparametric analysis Main steps PET image registration based on the CT associated with the PET scans PET1 PET2 - T21 =
Identification of the transformation needed to realign the 2 CT T21 (rigid transform using Block Matching) CT2 CT2 T21 PET1 PET2 Step 1 VOI selection CT1 CT2 PET1 PET2 Registration of the PET volumes using the T21 transformation realigned with
= - T21{PET2} – PET1/CT1 T21{PET2/CT2} PET1/CT1 Each point corresponds to a voxel Step 2 Subtraction of the 2 realigned PET scans
K f(xi|) = pk(xi|k,k) mixture density 2D Gaussian density k=1 mixture parameters vector of parameters (p1, … pK, 1, ….K, 1, … K) Step 3 Identification of the significant tumor changes in the 2D-space by solving a Gaussian mixture model PET1(i)-PET2(i) PET1(i) xi
Step 3: results Nb of voxels Background Tumor voxels [PET1 - T21{PET2}] SUV Physiological changes [PET1] SUV 0 -3 -6 DSUV Parametric image DV: volume with a significant change DSUV: change magnitude
Progressive* +1.3 PET1 T21{PET2} PET3 T21{PET2} - PET1 after solving the GMM +1.6 PET1 T21{PET2} PET3 T21{PET2} - PET1 after solving the GMM Example Identification of small tumor changes (lung cancer)
Clinical validation : 28 patients with metastatic colorectal cancer 78 tumors with 2 PET/CT (baseline and 14 days after starting treatment) NPV PPV Sensitivity* Specificity EORTC 91% 38% 85% 52% PI 100% 43% 100% 53% * for detecting lesions • All tumors identified as progressive tumors at D14 were confirmed as such 6 to 8 weeks after based on CT (RECIST criteria) • Among the 14 tumors identified as progressive tumors by RECIST criteria, 12 were identified as such at D14 using PI while only 2 were identified using EORTC criteria (SUVmax) Necib et al, J Nucl Med 2011
Comparing more than 2 PET/CT scans Longitudinal study 0 12 23 35 46 time (weeks) Problem : characterize the tumor changes No method, each scan is usually compared only to the previous one
A parametric imaging solution First step: PET image registration based on the associated CT T31 … T21 Rigid transformation Block Matching 0 12 23 35 46 Time (weeks) Use of the transformation identified based on the CT to register the PET scans T31 … T21
Model : a factor analysis model K SUV ( i , t ) I ( i ). f ( t ) ( t ) S = + e k k k k 1 = • SUV units time voxel i SUV I1(i). + I2(i). + I3(i). t t t time Stable uptake over time f1(t) Decreasing uptake over time f2(t) Increasing uptake over time f3(t)
Solving the model K SUV ( i , t ) I ( i ). f ( t ) ( t ) S = + e k k k k 1 = • Priors : • Non-negative Ik(i) coefficients • Non-negative fk(t) values • In each voxel, the variance of the voxel value is roughly proportional to the mean Iterative identification of Ik(i) et fk(t) (Buvat et al Phys Med Biol 1998) using a Correspondence Analysis followed by an oblique rotation of the orthogonal eigenvectors
Sample results Lung cancer patient with 5 PET/CT scans Normalized SUV 0 12 23 35 46 weeks
Why is such an approach useful? Heterogeneous tumor responses can be easily identified Normalized SUV 0 12 23 35 46 weeks
T1 T2 2 cycles 2 cycles - 4 cycles 12 weeks 12 23 weeks T1 T1 T2 T2 2 cyc - 4 cyc - 3 cycles 12 23 35 weeks Sample results: early detection of tumor recurrence (1) T1 T2 2 cyc-4 cyc-3 cyc-no cycle 12 23 35 46 weeks
B T2 T3 2 cycles - 4 cycles 12 23 weeks Sample results: early detection of tumor recurrence (2) EORTC : no tumor recurrence detected at PET3 SUVmean PET scan PI : tumor recurrence detected at PET3
Discussion / conclusion • No need to precisely delineate the tumors • Makes it possible to detect small changes in metabolic activity • Summarizes changes between two or more scans in a single image • Shows heterogeneous tumor response within a tumor or between tumors
Thanks to Hatem Necib, PhD Jacques Antoine Maisonobe, PhD student Michaël Soussan, MD Camilo Garcia, MD, Institut Jules Bordet, Bruxelles Patrick Flamen, MD, Institut Jules Bordet, Bruxelles Bruno Vanderlinden, MSc, Institut Jules Bordet, Bruxelles Alain Hendlisz, MD, Insitut Jules Bordet, Bruxelles