Download
1 / 34
340 likes | 474 Vues
Unit 11: Regression modeling in practice. The S-030 roadmap: Where’s this unit in the big picture?. Unit 1: Introduction to simple linear regression. Unit 2: Correlation and causality. Unit 3: Inference for the regression model. Building a solid foundation. Unit 5:

E N D
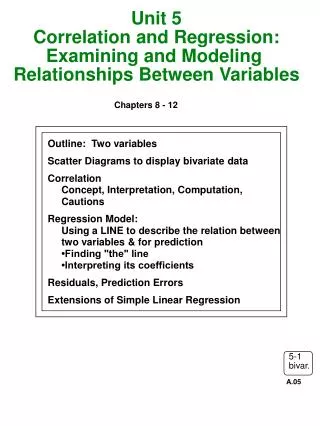
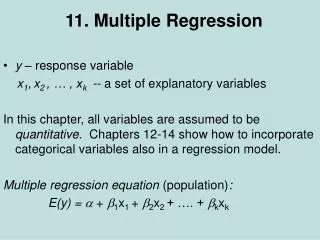
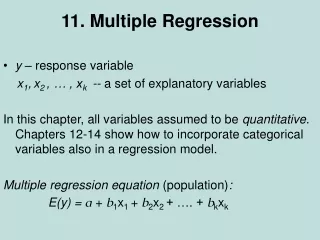
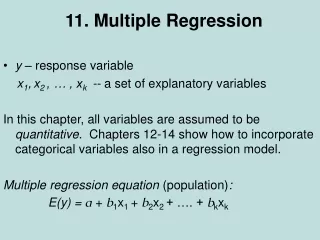
The S-030 roadmap: Where’s this unit in the big picture? Unit 1: Introduction to simple linear regression Unit 2: Correlation and causality Unit 3: Inference for the regression model Building a solid foundation Unit 5: Transformations to achieve linearity Unit 4: Regression assumptions: Evaluating their tenability Mastering the subtleties Adding additional predictors Unit 6: The basics of multiple regression Unit 7: Statistical control in depth: Correlation and collinearity Generalizing to other types of predictors and effects Unit 9: Categorical predictors II: Polychotomies Unit 8: Categorical predictors I: Dichotomies Unit 10: Interaction and quadratic effects Pulling it all together Unit 11: Regression modeling in practice
In this unit, we’re going to learn about… • Distinguishing between question predictors, covariates, and rival hypothesis predictors • Mapping your research questions onto an analytic strategy • What kinds of paths and feedback loops do you need? • Alternative analytic approaches—which are sound, which are unwise? • Which kinds of rival explanations can you examine and rule out? • What caveats and limitations still remain? • Constructing informative tables and figures • Writing up your results
Automated model building strategies (& why you don’t want to use them) The hallmark of good science is that it uses models and ‘theory’ but never believes them attributed to Martin Wilk in Tukey (1962) Far better an approximate answer to the right question…than an exact answer to the wrong question John W. Tukey (1962) All models are wrong, but some are useful George E.P. Box (1979) Occam’s razor: entia non sunt multiplicanda praeter necessitatemIf two competing theories lead to the same predictions, the simpler one is better William of Occam (14th century) • Automated model • building strategies • (that you may see in journal articles) • All possible subsets: all 2k-1 regression models • Forward selection: start with no predictors and sequentially add them so that each maximally increases the R2 statistic at that step • Backwards elimination: start with all predictors and sequentially drop them so that each minimally decreases the R2 statistic at that step • Stepwise regression (forward selection with backwards glances)
Introducing the case study (2004) Volume 15, Number 10, pp 674-679 RQ: “to determine whether…[the sentences of young Black and White male inmates] depended both on race and within race, on the degree to which they manifested Afrocentric facial features, controlling for the seriousness of the crimes they had committed and their prior criminal histories.” Hypothesis: “controlling for legally relevant factors, Black offenders as a group may not receive harsher sentences than White offenders, but members of both groups who have relatively more Afrocentric features may receive harsher sentences than group members with less Afrocentric features”
How the study was conducted: Online data and undergraduate raters 216 randomly selected felons, ages 18-24, who committed crimes between 1 Oct 1998 – 1 Oct 2002, stratified by race 100 Black 116 White Outcome Years = Sentence length • Predictors describing criminal history • Primary offense level (FL rates the offenses) • Secondary offenses: # & average level • Prior offenses: # & average level • Predictors describing facial features • Photos were randomly placed into groups and rated by ~35 undergraduates, using three 9 point scales • (1=not at all; 9=very much) • Attractiveness • Baby-faced-ness • “Afrocentric” features (Features)
A first look at the data Years ranges from 0.42 – 99 (for life in prison) (may need to deal with its very wide range) PrimLev ranges from 1 – 11 (from unauthorized driver’s license to murder) 33% of inmates had a prior offense, some several (mean # = 2.9; max # = 13!) This is somewhat low, probably due to the sample’s relative youth Prim Any N Sec Any N Prior ID Years Black Features Lev Sec Second Lev Prior Prior Lev Attr Baby 1 3.83 0 1.94286 7 1 1 5.00 0 0 0.00 2.00000 2.77143 2 11.50 1 6.20000 9 1 1 8.00 0 0 0.00 2.22857 2.65714 3 4.33 1 5.00000 9 0 0 0.00 0 0 0.00 5.26471 4.26471 4 17.17 1 7.85714 10 1 3 4.33 0 0 0.00 3.54286 3.62857 5 14.17 1 5.50000 6 1 1 6.00 1 4 4.25 2.00000 4.94118 6 4.42 0 5.88235 7 1 3 7.00 1 4 7.00 2.08824 5.67647 7 99.00 0 2.94286 11 1 3 6.33 0 0 0.00 3.57143 4.22857 8 4.67 1 6.97143 5 1 7 3.86 0 0 0.00 2.20000 3.85714 9 9.17 1 6.32353 9 1 3 4.67 0 0 0.00 3.44118 5.58824 10 9.17 1 5.40000 11 0 0 0.00 0 0 0.00 3.25714 6.42857 11 23.75 0 4.38235 11 0 0 0.00 0 0 0.00 2.23529 5.44118 12 9.00 1 4.23529 9 1 2 8.50 0 0 0.00 2.58824 4.61765 13 3.75 0 3.28571 8 0 0 0.00 0 0 0.00 1.57143 4.65714 14 13.33 0 6.64706 8 1 2 3.50 0 0 0.00 2.85294 3.67647 15 2.92 1 4.08571 9 1 3 9.00 0 0 0.00 4.40000 3.51429 16 3.67 1 7.02941 7 1 1 5.00 0 0 0.00 3.61765 4.35294 17 1.25 0 5.08571 9 1 3 5.50 0 0 0.00 2.82857 5.88571 18 3.42 0 1.88235 7 0 0 0.00 0 0 0.00 2.38235 6.38235 19 2.33 1 6.65714 4 0 0 0.00 1 10 3.80 3.65714 3.48571 20 1.92 1 4.32353 5 1 1 1.00 1 6 4.50 2.64706 2.79412 By design, sample is 46% Black rBLACK,Features= 0.74*** leaving lots of variation in Features within each group 75% of inmates had a secondary offense, some several (mean # = 3.2; max # = 41!) The average level of the 2nd offenses <= primary level Included because there’s previous evidence that attractiveness and baby-faced-ness is correlated with judicial decisions
How should you proceed when you have so many predictors Question predictor(s) Key control predictor(s) Additional control predictor(s) Rival hypothesis predictor(s) Challenge: 11 predictors = 211-1 = 2,047possible models (+ interactions!) • What have you done for HW assignments (and have we done in class)? • Describe the distributions of the outcome and predictors • Examine scatterplots of the outcome vs. each predictor, transforming as necessary (with supplemental residual plots to guide transformation) • Examine estimated correlation matrix to see what it foreshadows for model building • If there is a clear predictor for which to control statistically, examine the estimated partial correlation matrix to further foreshadow model building • Thoughtfully fit a series of MR models • Examine the series to select a “final” model that you believe best summarizes your findings • But with > 3 or 4 predictors, model building (step 5) becomes unwieldy… Advice: Before doing any analysis, place your predictors into up to four conceptual groupsbased on a combination of substance/theory and their role in your statistical analyses
Developing a taxonomy of fitted models (using the predictor classifications) Rival hypothesis predictors Attractiveness Baby-faced-ness Additional control predictors Secondary offenses Prior offenses Question predictors Black and Features Key control predictors Primary offense level • Strategy 1: • Question predictors first • Start with your question predictors: after all, those are the variables in which you’re most interested • Add key control predictorsassessing whether the effects change—probably keep the key control predictors in the model regardless • Add additional control predictors, keeping them in the model only as necessary • Check rival hypothesis predictors to see whether the effects of the question predictors remain • Strategy 2: • Build a control model first • Start with the key control predictors: after all, you’re pretty confident they have a major effect that you need to remove • Add additional control predictors, keeping them in the model only as necessary • Add the question predictors seeing whether they have an effect over and above the control predictors • Check rival hypothesis predictors to see whether the effects of the question predictors remain Or some combination Often the approach of choice because it focuses attention on the question predictors Preferable when the effects of the control predictors are so well established that beyond a first “peek” it’s difficult to think about examining the question predictors uncontrolled Don’t forget there’s a difference between how you do the analysis and how you report the results
Let’s begin by examining the outcome: Length of prison sentence Variable: Years Mean 6.835694 Std Deviation 15.54396 Histogram # Boxplot 97.5+** 5 * . . . . . . . .* 1 * . . . . .* 1 * .* 2 * .* 4 * .* 3 * .** 7 0 .******* 28 0 2.5+****************************************** 165 +-----+ ----+----+----+----+----+----+----+----+-- * may represent up to 4 counts “because sentence length was skewed, a log-transformation was performed on this variable prior to analysis” Because the relationship between sentence length (in years) and key predictors was markedly nonlinear, we transformed the outcome (by taking natural logarithms) and fit a series of regression models predicting log sentence length. Plots vs. question and key control predictors
Having logged the outcome, what should we do next? r = 0.67*** r = 0.07(ns) • Which model building strategy makes the most sense given that… • The effect of the question predictor (Features) is statistically significant (p<0.05) but relatively modest (r=0.15) • There’s no difference in sentence length by race (r=0.07, ns) • But…the effect of the key control predictor (Primary Offense Level) is very strong (r=0.67, p<0.0001) • Decision: Variable: LYears Mean 1.128249 Std Deviation 1.06197 Histogram # Boxplot 4.75+*** 5 0 .* 1 0 .* 1 0 .*** 6 0 .**** 8 | .*********** 21 | .********* 18 +-----+ .*********************** 45 | + | .************************* 49 *-----* .******************* 37 +-----+ .********** 19 | -0.75+*** 6 | ----+----+----+----+----+ * may represent up to 2 counts Plots vs. question and key control predictors r = 0.15*
What functional form should we use for Primary Offense Level? Variable: PrimLev Mean 6.541667 Std Deviation 2.07154 Median 7.000000 Variance 4.29128 Mode 5.000000 Range 10.00000 Stem Leaf # Boxplot 11 0000000 7 | 10 | 10 00000 5 | 9 | 9 00000000000000000000000000000000000000 38 | 8 | 8 0000000000000000000 19 +-----+ 7 | | 7 0000000000000000000000000000000000000000 40 *-----* 6 5555 4 | + | 6 0000000000000000000000 22 | | 5 | | 5 0000000000000000000000000000000000000000000 43 +-----+ 4 | 4 000000000000000000000000000000 30 | 3 | 3 0000 4 | 2 | 2 000 3 | 1 | 1 0 1 | ----+----+----+----+----+----+----+----+--- “We also included quadratic terms for seriousness of the primary offense… because the Florida Criminal Punishment Code specifies that for more serious offenses, the length of the sentence ought to increase dramatically as the seriousness of the offense increases.” Linear Model: R2 = 0.4539 Parameter Standard Variable DF Estimate Error t Value Pr > |t| Intercept 1 -1.13117 0.17766 -6.37 <.0001 PrimLev 1 0.34539 0.02590 13.34 <.0001 Quadratic Model: R2 = 0.5030 Parameter Standard Variable DF Estimate Error t Value Pr > |t| Intercept 1 0.74718 0.44331 1.69 0.0934 PrimLev 1 -0.28180 0.13895 -2.03 0.0438 PrimLevSq 1 0.04726 0.01030 4.59 <.0001
A first look at the effects of the other control variables Inmates with more severe secondary offenses have, on average, more severe primary offenses and longer sentences (but there’s no effect of the presence of secondary offenses, and less effect of the #) Pearson Correlation Coefficients, N = 216 Prob > |r| under H0: Rho=0 LYears PrimLev AnySec SecLev NSecond AnyPrior PriorLev LYears 1.00000 0.67374 0.03399 0.36529 0.19168 -0.20537 -0.15635 <.0001 0.6193 <.0001 0.0047 0.0024 0.0215 PrimLev 0.67374 1.00000 -0.04221 0.30743 -0.03511 -0.30738 -0.22443 <.0001 0.5373 <.0001 0.6078 <.0001 0.0009 AnySec 0.03399 -0.04221 1.00000 0.77439 0.35567 0.16014 0.10670 0.6193 0.5373 <.0001 <.0001 0.0185 0.1179 SecLev 0.36529 0.30743 0.77439 1.00000 0.30844 -0.05396 -0.03146 <.0001 <.0001 <.0001 <.0001 0.4301 0.6457 NSecond 0.19168 -0.03511 0.35567 0.30844 1.00000 -0.05159 -0.05633 0.0047 0.6078 <.0001 <.0001 0.4507 0.4101 AnyPrior -0.20537 -0.30738 0.16014 -0.05396 -0.05159 1.00000 0.89362 0.0024 <.0001 0.0185 0.4301 0.4507 <.0001 PriorLev -0.15635 -0.22443 0.10670 -0.03146 -0.05633 0.89362 1.00000 0.0215 0.0009 0.1179 0.6457 0.4101 <.0001 NPrior -0.11997 -0.20655 0.13546 0.01684 -0.00930 0.71445 0.54775 0.0785 0.0023 0.0468 0.8057 0.8919 <.0001 <.0001 As expected, the three variables describing secondary and (especially) prior offenses are positively related Two analytic issues: 1 Should we be controlling for the effects of primary offense level? 2 Given Florida statutes, we might also ask about functional form—might the effects of some of these predictors also be non-linear? Overall, there’s little relationship between prior offenses and secondary offenses Inmates with prior offenses have, on average, less severe primary offenses and (?therefore?) shorter sentences
Addressing issue 1: A second look at the other control predictors, partialling out the effects of PrimLev & PrimLev2 The positive effect of the number (and level) of secondary offenses persists (but ANYSEC still appears to have no effect) Pearson Partial Correlation Coefficients, N = 216 Prob > |r| under H0: Partial Rho=0 LYears SecLev NSecond AnySec PriorLev NPrior LYears 1.00000 0.22803 0.30637 0.11599 -0.00959 0.04104 0.0008 <.0001 0.0905 0.8890 0.5505 SecLev 0.22803 1.00000 0.33585 0.83363 0.04033 0.08743 0.0008 <.0001 <.0001 0.5574 0.2027 NSecond 0.30637 0.33585 1.00000 0.35583 -0.06592 -0.01704 <.0001 <.0001 <.0001 0.3372 0.8043 AnySec 0.11599 0.83363 0.35583 1.00000 0.10080 0.12664 0.0905 <.0001 <.0001 0.1416 0.0644 PriorLev -0.00959 0.04033 -0.06592 0.10080 1.00000 0.52661 0.8890 0.5574 0.3372 0.1416 <.0001 NPrior 0.04104 0.08743 -0.01704 0.12664 0.52661 1.00000 0.5505 0.2027 0.8043 0.0644 <.0001 AnyPrior -0.00512 0.04419 -0.06556 0.15752 0.88939 0.70100 0.9407 0.5202 0.3399 0.0212 <.0001 <.0001 Conclusion: (should also note that we double-checked the functional form of prior offenses and there was still no effect) The distinctiveness of prior and secondary offenses persists -- these sets of predictors seem fairly distinct The negative effect of prior offenses disappears upon control for severity of the primary offense (thankfully)
Addressing issue 2: Functional form for secondary offense predictors LNSecond = ln(NSecond + 1) “We also included quadratic terms for … seriousness of additional offenses … because the Florida Criminal Punishment Code specifies that for more serious offenses, the length of the sentence ought to increase dramatically as the seriousness of the offense increases.” Uncontrolled Model: R2 = 0.2911 Parameter Standard Variable DF Estimate Error t Value Pr > |t| Intercept 1 1.00906 0.11647 8.66 <.0001 SecLev 1 -0.27569 0.06638 -4.15 <.0001 SecLevSq 1 0.05821 0.00846 6.88 <.0001 Controlling for Primary offenses: R2 = 0.5363 Parameter Standard Variable DF Estimate Error t Value Pr > |t| Intercept 1 0.64277 0.43118 1.49 0.1375 PrimLev 1 -0.23931 0.13853 -1.73 0.0856 PrimLevSq 1 0.04022 0.01055 3.81 0.0002 SecLev 1 -0.03298 0.05942 -0.56 0.5795 SecLevSq 1 0.01488 0.00809 1.84 0.0672 “starting” a variable r = .19 (p=.0047) r = .17 (p=.0150)
Finalizing the “control” model for the effects of severity of crimes Double checked effects of other crime predictors (AnyPrior, NPrior, PriorLev & AnySec) in uncontrolled and controlled models and all were n.s. “Final” control model: R2 = 0.5712 Parameter Standard Variable DF Estimate Error t Value Pr > |t| Intercept 1 0.43362 0.41871 1.04 0.3016 PrimLev 1 -0.18643 0.13415 -1.39 0.1661 PrimLevSq 1 0.03650 0.01021 3.57 0.0004 SecLev 1 -0.22487 0.07374 -3.05 0.0026 SecLevSq 1 0.03220 0.00885 3.64 0.0003 LNSecond 1 0.40356 0.09766 4.13 <.0001 “The results of the analysis showed, as expected, that criminal record accounted for a substantial amount of the variance (57%) in sentence length. The resulting unstandardized coefficients (and their standard errors and associated t statistics) are given in Table 1 (Model 1). Unsurprisingly, the seriousness of the primary offense (linear and quadratic effects) and both the seriousness (quadratic effect) and the number of additional offenses were significant predictors of sentence length. Neither the seriousness nor the number of prior offenses predicted sentence length. We attribute these null effects to the relative youthfulness of the inmates, who had relatively few prior felony offenses (mean=0.95, sd=1.90)”
Examining the effects of the question predictors: Uncontrolled & controlled rBlack, Features = .74 Black White Features In uncontrolled models, there is a statistically significant interaction between Race and Features (such that Whites with higher values get longer sentences, while for Blacks, there’s no effect). In controlled models, there are main effects of Race and Features, but there is no interaction between the two. Controlling for severity and number of offenses: (1) Blacks and Whites with more “afrocentric” features receive longer sentences; and (2) controlling for features, Whites receive longer sentences than Blacks
What about the rival hypothesis predictors?: Attractiveness & Baby-faced-ness Question predictor effects remain even controlling for the rival hypothesis predictors The rival hypothesis predictors have no effect (we also tested these predictors separately and found the same thing) What predictors should we include in our “final” model??? Adding Attractiveness and Baby-faced-ness to the “final” model Parameter Standard Variable DF Estimate Error t Value Pr > |t| Intercept 1 0.17736 0.49786 0.36 0.7220 PrimLev 1 -0.19096 0.13371 -1.43 0.1548 PrimLevSq 1 0.03649 0.01018 3.58 0.0004 SecLev 1 -0.22544 0.07420 -3.04 0.0027 SecLevSq 1 0.03244 0.00887 3.66 0.0003 L2NSecond 1 0.39795 0.09812 4.06 <.0001 Black 1 -0.30791 0.14194 -2.17 0.0312 Features 1 0.09469 0.04100 2.31 0.0219 baby 1 0.02305 0.04426 0.52 0.6031 attr 1 -0.02805 0.05524 -0.51 0.6121 “Finally, we examined the influence of facial attractiveness and babyish features on sentence length. Controlling for criminal record, neither variable was a significant predictor of sentence length, t(206) = 0.05 and t(206) = 0.65, respectively. Moreover, Afrocentric features continued to predict sentence length when these variables were controlled t(203) =2.32, p<0.025.” Final check:We tested for statistical interactions between our two question predictors, Black and Features, and all other predictors in the model: None were statistically significant
What would have happened if we used an automated strategy? All variables transformed as we did in our analyses All variables kept in raw form Forward selection Backward elimination Stepwise regression Forward selection Backward elimination Stepwise regression PrimLev*** PrimLev*** PrimLev*** PrimLev~ PrimLev~ PrimLev~ SecLev* SecLev** SecLev** PrimLevSq*** PrimLevSq*** PrimLevSq*** Nsecond* Nsecond* Nsecond* SecLevSq*** SecLevSq*** SecLevSq*** AnySec* AnySec* AnySec* LNSecond*** LNSecond*** LNSecond*** AnySec*** AnySec** AnySec*** Attr~ Attr~ Attr~ Black* Features*
Examining residuals from “final” model n = 13 (6.0%) Stem Leaf # Boxplot 2 779 3 0 2 0144 4 | 1 5556667789 10 | 1 00011223334444 14 | 0 55555555566666666666667788888899999999 38 +-----+ 0 001111111222222233333333444444444 33 | + | -0 444444443333333322222222222211111111111100000 45 *-----* -0 999999988888887777777666666655555555555 39 +-----+ -1 443322211110 12 | -1 888877555555 12 | -2 4430 4 | -2 97 2 0 ----+----+----+----+----+----+----+----+----+ Reasonably symmetric
Contemplating a graph that displays the findings Florida Criminal Punishment Code Severity Ranking ChartSection 921.0022, Florida Statutes Black White Ln (sentence length) Very serious crime White White Black Black Less serious crime Features Average crime White Black PrimLev Stem Leaf # Boxplot 11 0000000 7 | 10 | 10 00000 5 | 9 | 9 00000000000000000000000000000000000000 38 | 8 | 8 0000000000000000000 19 +-----+ 7 | | 7 0000000000000000000000000000000000000000 40 *-----* 6 5555 4 | + | 6 0000000000000000000000 22 | | 5 | | 5 0000000000000000000000000000000000000000000 43 +-----+ 4 | 4 000000000000000000000000000000 30 | 3 | 3 0000 4 | 2 | 2 000 3 | 1 | 1 0 1 | ----+----+----+----+----+----+----+----+--- Mean 6.54167 Std Dev 2.07154 100% Max 11 90% 9 75% Q3 8 50% Median 7 25% Q1 5 10% 4 0% Min 1 Aggravated child abuse (9) Aggravated battery on an officer (7) Possessing child pornography (5) Grand theft between 5-10K (3) False driver’s license (1)
Computing fitted values to create prototypical plots Model G: Main effects of Black & Features, controlling for severity of offense Parameter Standard Variable DF Estimate Error t Value Pr > |t| Intercept 1 0.18504 0.43271 0.43 0.6694 PrimLev 1 -0.18960 0.13302 -1.43 0.1556 PrimLevSq 1 0.03663 0.01013 3.62 0.0004 SecLev 1 -0.22333 0.07365 -3.03 0.0027 SecLevSq 1 0.03216 0.00881 3.65 0.0003 L2NSecond 1 0.39574 0.09770 4.05 <.0001 Black 1 -0.30321 0.14127 -2.15 0.0330 Features 1 0.08978 0.03990 2.25 0.0255 Identifying reasonable plotting limits for Features for Blacks and Whites Computing fitted values of ln(Sentence Length), by Features, Black, and Severity of primary offense 95th%ile 7.59 95th%ile 6.23 5th%ile 3.99 5th%ile 1.94 White limits: 2 – 6 Black limits: 4 - 8
Summarizing the effects of crime severity, race and features Ln(Yrs) Very serious crime White White White Black Black Black Moderately serious crime Less serious crime Features “…when we examined the race difference in sentence length controlling for Afrocentric features, we were comparing White inmates with relatively high levels of Afrocentric features and Black inmates with relatively low levels.” Race Controlling for severity and facial features, Blacks have shorter sentences than Whites “At the two within-group mean levels, there was no difference in sentence length between the groups.” Severity of crime The more serious the crime, the longer the sentence (and the more serious the crime, the larger the effect of seriousness) Features The more “afrocentric” one’s facial features, the longer his sentence (for individuals of both races) Mean for Whites = 3.09 Mean for Blacks = 5.92
What tables and graphs might we present in a paper or presentation? Don’t forget to distinguish between how you do the analysis and how you report the results • Four sets of evidence in • a typical research presentation • Descriptive statistics: a table summarizing distributions (often by interesting subgroups) • Correlation matrixsummarizing relationships among variables (sometimes with partials as well) • Selected regression results documenting key findings from the analysis (not every model you fit) • Prototypical plots summarizing the major findings (probably the plot we just constructed) • Helpful hints about presenting results • Decide on your key points: Your text, tables and displays (appropriately titled and organized) should support that argument • Think about your reader, not yourself:take the reader’s perspective and supply evidence that helps him/her evaluate your argument • Try out alternative displays and text: your first attempt is rarely your best • Writing up your results usually helps solidify—and often modify—your major argument, tables and graphs: Learn from writing; re-writing is essential
Table 1. Estimated means and sd’s by race (with t-statistics testing for differences in means by race) Estimated mean sentence lengths are 5.77 years for Whites and 8.08 for Blacks; the difference is not statistically significant. The mean primary offense level for Black felons (6.93) is significantly higher than the mean for White felons (5.84) 65% of White felons and 76% of Black felons had a secondary offense. This difference is not statistically significant nor is the difference between Black and White felons with respect to the number or severity of secondary offenses 23% of White felons and 34% of Black felons had a history of prior offenses. This difference is not statistically significant nor is the difference between Black and White felons with respect to the number or severity of prior offenses On average, Black felons had significantly more afrocentric features than White felons (5.92 vs 3.09, t=-15.86, p<0.0001), but within both groups there is substantial variation (standard deviations of 1.11 and 1.27 respectively) On average, Black felons were significantly more attractive than White felons (3.36 vs 2.90, t=-2.27, p<0.05), but the two groups were equivalent with respect to baby-faced-ness
Table 2. Correlation matrix and Partial Correlation Matrix (controlling for primary offense level (in linear and quadratic form) n=216)
Table 3. Results of fitting a taxonomy of multiple regression models
Here’s how they presented the MR results “We turn next to the question of race differences in sentencing. We estimated a second model (Model 2) in which inmate race (-1 if White, +1 if Black) was entered as a predictor along with the variables from the previous model. … The race of the offender did not account for a significant amount of variance in sentence length over and above the effects of seriousness and number of offenses, t(206) = 0.90, p = .37.” [Notice that they refer to “Model 2” but they chose not to present it]
Two alternative graphic displays of findings Ln(Yrs) White White White Very serious crime Black Black Black 2.5 Moderately serious crime 2.0 1.5 Less serious crime 1.0 0.5 0.0 2 3 4 5 6 7 8 Features
Another example of model building: The Father Presence study “A hierarchical linear regression analysis was conducted to determine the effects of fathers’ antisocial behavior and fathers’ presence on child antisocial behavior. Fathers’ antisocial behavior (r=.30, p<.001) and fathers’ presence (r=-.16, p<.001) were significantly correlated with child behavior problems. … The interaction was statistically significant, slope = .28, p<.001). We conducted four additional analyses to test the robustness of the interaction between fathers’ antisocial behavior and father presence. First, we tested whether fathers’ antisocial behavior moderated the effect of father presence controlling for the presence of nonbiological father figures in the home. Second, we tested whether fathers’ antisocial behavior moderated the effect of father presence, controlling for maternal antisocial behavior. Third, we tested whether the interaction between fathers’ antisocial behavior and father presence predicted child behavior problems in the clinical range. Fourth, we tested whether fathers’ antisocial behaviormoderated a more fine-grained measure of his involvement, such as his caretaking behavior.” At the first step, we asked whether fathers’ antisocial behavior and father presence independently predicted child behavior problems. The model was estimated as: Fathers’ antisocial behavior significantly predicted elevated levels of child antisocial behavior (slope = 0.32, p<0.001), but father presence did not when fathers’ antisocial behavior was controlled (slope = 1.80, p=.33). At the second step, we asked whether the effect of father presence was moderated by fathers’ antisocial behavior. Thus, the interaction between fathers’ antisocial behavior and father presence was entered and the model was estimated as:
These same model building strategies can apply to more complex models! (n=57) (n=51) More complex residual term Narrative development in bilingual kindergarteners: Can Arthur help?Yuuko Uchikoshi (2005) Developmental Psychology RQ:Can narrative skills be ‘taught’ via TV to English Language Learners?
The S-052 Roadmap (Courtesy of John B. Willett) Use influence statistics to detect atypical datapoints Test for residual normality Multiple Regression Analysis If your residuals are not independent, replace OLS byGLS regression analysis If you have more predictors than you can deal with, If your outcome is categorical, you need to use… If your outcome vs. predictor relationship isnon-linear, Specify a Multilevel Model Create taxonomies of fitted models and compare them. Discriminant Analysis Binomiallogistic regression analysis(dichotomous outcome) Multinomial logistic regression analysis(polychotomous outcome) Form composites of the indicators of any common construct. Are the data longitudinal?Use Individual growth modeling Use non-linear regression analysis. If time is a predictor, you need discrete-time survival analysis… Use Cluster Analysis Do your residuals meet the required assumptions? Go to supplemental resources on course website Transform the outcome or predictor Conduct a Principal Components Analysis
What’s the big takeaway from this unit? • Be guided by the research questions • Don’t go on fishing expeditions fitting all possible subsets and don’t rely on computers to select models for fitting • No automated model selection routine can replace thoughtful model building strategies • It’s wise to divide your predictors into substantive groupings and use those groupings to guide the analysis • There is no single “right answer” or “right model” • Different researchers may make different analytic decisions; hopefully, substantive findings about question predictors won’t change (but they can) • Different researchers will choose to make different decisions about what information to present in a paper; hopefully, regardless of approach, there will be sufficient information to judge the soundness of the conclusions • You can do data analysis! • Think back to the beginning of the semester; you’ve all come a long way • You can judge the soundness of a research presentation; don’t believe everything you read and be sure to read the methods section • No matter how much you learn about data analysis, there’s always more to learn!