Download
1 / 41
410 likes | 658 Vues
Multi-Experiment Performance Data Management and Data Mining. Allen D. Malony malony@cs.uoregon.edu Department of Computer and Information Science Performance Research Laboratory University of Oregon. Outline of Talk. Performance problem solving

E N D
Multi-Experiment Performance Data Management and Data Mining Allen D. Malony malony@cs.uoregon.edu Department of Computer and Information Science Performance Research Laboratory University of Oregon
Outline of Talk • Performance problem solving • Scalability, productivity, and performance technology • Application-specific and autonomic performance tools • TAU parallel performance system • Performance data management and data mining • Performance Data Management Framework (PerfDMF) • PerfExplorer • Multi-experiment case studies • Comparative analysis (PERC tool study) • Clustering analysis • Future work and concluding remarks
PerformanceTuning PerformanceTechnology hypotheses Performance Diagnosis • Experimentmanagement • Performancestorage PerformanceTechnology properties Performance Experimentation • Instrumentation • Measurement • Analysis • Visualization characterization Performance Observation Research Motivation • Tools for performance problem solving • Empirical-based performance optimization process • Performance technology concerns
Challenges in Performance Problem Solving • How to make the process more effective (productive)? • Process may depend on scale of parallel system • Standard approaches deliver a lot of data with little value • What are the important events and performance metrics? • Tied to application structure and computational model • Process and tools can be more application-aware • Tools have poor support for application-specific aspects • What are the significant issues that will affect the technology used to support the process? • Enhance application development and benchmarking • New paradigm in performance process and technology
Role of Automation and Knowledge Discovery • Scale forces the process to become more intelligent • Even with intelligent and application-specific tools, the decisions of what to analyze is difficult and intractable • More automation and knowledge-based decision making • Build autonomic capabilities into the tools • Support broader experimentation methods and refinement • Access and correlate data from several sources • Automate performance data analysis / mining / learning • Include predictive features and experiment refinement • Knowledge-driven adaptation and optimization guidance • Address scale issues through increased expertise
TAU Performance System • Tuning and Analysis Utilities (13+ year project effort) • Performance system framework for HPC systems • Integrated, scalable, flexible, and parallel • Targets a general complex system computation model • Entities: nodes / contexts / threads • Multi-level: system / software / parallelism • Measurement and analysis abstraction • Integrated toolkit for performance problem solving • Instrumentation, measurement, analysis, and visualization • Portable performance profiling and tracing facility • Performance data management and data mining • University of Oregon , Research Center Jülich, LANL
Important Questions for Application Developers • How does performance vary with different compilers? • Is poor performance correlated with certain OS features? • Has a recent change caused unanticipated performance? • How does performance vary with MPI variants? • Why is one application version faster than another? • What is the reason for the observed scaling behavior? • Did two runs exhibit similar performance? • How are performance data related to application events? • Which machines will run my code the fastest and why? • Which benchmarks predict my code performance best?
Performance Problem Solving Goals • Answer questions at multiple levels of interest • Data from low-level measurements and simulations • use to predict application performance • High-level performance data spanning dimensions • machine, applications, code revisions, data sets • examine broad performance trends • Discover general correlations application performance and features of their external environment • Develop methods to predict application performance on lower-level metrics • Discover performance correlations between a small set of benchmarks and a collection of applications that represent a typical workload for a given system
Automatic Performance Analysis Tool (Concept) PSU: Kathryn Mohror, Karen Karavanic UO: Kevin Huck LLNL: John May, Brian Miller (CASC) PerfTrack Performance Database
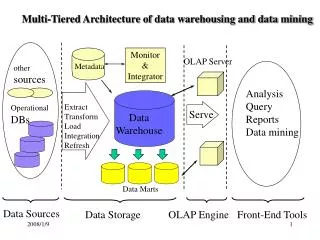
ParaProf Performance Profile Analysis Raw files HPMToolkit PerfDMFmanaged (database) Metadata MpiP Application Experiment Trial TAU
PerfExplorer (K. Huck, UO) • Performance knowledge discovery framework • Use the existing TAU infrastructure • TAU instrumentation data, PerfDMF • Client-server based system architecture • Data mining analysis applied to parallel performance data • Technology integration • Relational DatabaseManagement Systems (RDBMS) • Java API and toolkit • R-project / Omegahat statistical analysis • Web-based client • Jakarta web server and Struts (for a thin web-client)
PerfExplorer Architecture Server accepts multiple client requests and returns results Server supports R data mining operations built using RSJava PerfDMF Java API used to access DBMS via JDBC Client is a traditional Java application with GUI (Swing) Analyses can be scripted, parameterized, and monitored Browsing of analysis results via automatic web page creation and thumbnails
PERC Tool Requirements and Evaluation • Performance Evaluation Research Center (PERC) • DOE SciDAC • Evaluation methods/tools for high-end parallel systems • PERC tools study (led by ORNL, Pat Worley) • In-depth performance analysis of select applications • Evaluation performance analysis requirements • Test tool functionality and ease of use • Applications • Start with fusion code – GYRO • Repeat with other PERC benchmarks • Continue with SciDAC codes
GYRO Execution Parameters • Three benchmark problems • B1-std : 16n processors, 500 timesteps • B2-cy : 16n processors, 1000 timesteps • B3-gtc : 64n processors, 100 timesteps • Test different methods to evaluate nonlinear terms: • Direct method • FFT (“nl2” for B1 and B2, “nl1” for B3) • Task affinity enabled/disabled (p690 only) • Memory affinity enabled/disabled (p690 only) • Filesystem location (Cray X1 only)
Primary Evaluation Machines • Phoenix (ORNL – Cray X1) • 512 multi-streaming vector processors • Ram (ORNL – SGI Altix (1.5 GHz Itanium2)) • 256 total processors • TeraGrid • ~7,738 total processors on 15 machines at 9 sites • Cheetah (ORNL – p690 cluster (1.3 GHz, HPS)) • 864 total processors on 27 compute nodes • Seaborg (NERSC – IBM SP3) • 6080 total processors on 380 compute nodes
Region (Events) of Interest • Total program is measured, plus specific code regions • NL : nonlinear advance • NL_tr* : transposes before / after nonlinear advance • Coll : collisions • Coll_tr* : transposes before/after main collision routine • Lin_RHS : compute right hand side of the electron and ion GKEs (GyroKinetic (Vlasov) Equations) • Field : explicit or implicit advance of fields and solution of explicit maxwell equations • I/O, extras Communication
Data Collected Thus Far… • User timer data • Self instrumentation in the GYRO application • Outputs aggregate data per N timesteps • N = 50 (B1, B3) • N = 125 (B2) • HPM (Hardware Performance Monitor) data • IBM platform (p690) only • MPICL profiling/tracing • Cray X1 and IBM p690 • TAU (all platforms, profiling/tracing, in progress) • Data processed by hand into Excel spreadsheets
PerfExplorer Analysis of Self-Instrumented Data • PerfExplorer • Focus on comparative analysis • Apply to PERC tool evaluation study • Look at user timer data • Aggregate data • no per process data • process clustering analysis is not applicable • Timings output every N timesteps • some phase analysis possible • Goal • Recreate manually generated performance reports
Comparative Analysis • Supported analysis • Timesteps per second • Relative speedup and efficiency • For entire application (compare machines, parameters, etc.) • For all events (on one machine, one set of parameters) • For one event (compare machines, parameters, etc.) • Fraction of total runtime for one group of events • Runtime breakdown (as a percentage) • Initial analysis implemented as scalability study • Future analysis • Arbitrary organization • Parametric studies
PerfExplorer Interface Experimentmetadata Select experiments and trials of interest Data organized in application, experiment, trial structure (will allow arbitrary in future)
PerfExplorer Interface Select analysis
Timesteps per Second • Cray X1 is the fastest to solution in all 3 tests • FFT (nl2) improves time for B3-gtc only • TeraGrid faster than p690 for B1-std? • Plots generated automatically B1-std B1-std TeraGrid B3-gtc B2-cy B3-gtc
Relative Efficiency (B1-std) • By experiment (B1-std) • Total runtime (Cheetah (red)) • By event for one experiment • Coll_tr (blue) is significant • By experiment for one event • Shows how Coll_tr behaves for all experiments Cheetah Coll_tr 16 processorbase case
Relative Speedup (B2-cy) • By experiment (B2-cy) • Total runtime (X1 (blue)) • By event for one experiment • NL_tr (orange) is significant • By experiment for one event • Shows how NL_tr behaves for all experiments
Fraction of Total Runtime (Communication) • IBM SP3 (cyan) has the highest fraction of total time spent in communication for all three benchmarks • Cray X1 has the lowest fraction in communication B1-std B2-cy B3-gtc
Runtime Breakdown on IBM SP3 • Communications grows as a percentage of total as the application scales (colors match in graphs) • Both Coll_tr (blue) and NL_tr (orange) scale poorly • I/O (green) scales poorly, but its percentage of total runtime is small
Clustering Analysis • “Scalable Analysis Techniques for Microprocessor Performance Counter Metrics,” Ahn and Vetter, SC2002 • Applied multivariate statistical analysis techniques to large datasets of performance data (PAPI events) • Cluster Analysis and F-Ratio • Agglomerative Hierarchical Method - dendogram identified groupings of master, slave threads in sPPM • K-means clustering and F-ratio - differences between master, slave related to communication and management • Factor Analysis • shows highly correlated metrics fall into peer groups • Combined techniques (recursively) leads to observations of application behavior hard to identify otherwise
n i=0 Similarity Analysis • Can we recreate Ahn and Vetter’s results? • Apply techniques from the phase analysis (Sherwood) • Threads of execution can be compared for similarity • Threads with abnormal behavior show up as less similar • Each thread is represented as a vector (V) of dimension n • n is the number of functions in the application V = [f1, f2, …, fn] (represent event mix) • Each value is the percentage of time spent in that function • normalized from 0.0 to 1.0 • Distance calculated between the vectors U and V: ManhattanDistance(U, V) = ∑ |ui - vi|
sPPM on Blue Horizon (64x4, OpenMP+MPI) • TAU profiles • 10 events • PerfDMF • threads 32-47
sPPM on MCR (total instructions, 16x2) • TAU/PerfDMF • 120 events • master (even) • worker (odd)
sPPM on MCR (PAPI_FP_INS, 16x2) • TAU profiles • PerfDMF • master/worker • higher/lower Same result as Ahn/Vetter
sPPM on Frost (PAPI_FP_INS, 256 threads) • View of fewer than half of the threads of execution is possible on the screen at one time • Three groups are obvious: • Lower ranking threads • One unique thread • Higher ranking threads • 3% more FP • Finding subtle differences is difficult with this view
sPPM on Frost (PAPI_FP_INS, 256 threads) • Dendrogram shows 5 natural clusters: • Unique thread • High ranking master threads • Low ranking master threads • High ranking worker threads • Low ranking worker threads • TAU profiles • PerfDMF • R direct access to DM • R routine threads
sPPM on MCR (PAPI_FP_INS, 16x2 threads) masters slaves
sPPM on Frost (PAPI_FP_INS, 256 threads) • After K-means clustering into 5 clusters • Similar clusters are formed (seed with group means) • Each cluster’s performance characteristics analyzed • Dimensionality reduction (256 threads to 5 clusters!) SPPM INTERF DIFUZE DINTERF Barrier [OpenMP:runhyd3.F <604,0>] 10 119 1 6 120
Current and Future Work • ParaProf • Developing 3D performance displays • PerfDMF • Adding new database backends and distributed support • Building support for user-created tables • PerfExplorer • Extending comparative and clustering analysis • Adding new data mining capabilities • Building in scripting support • Performance regression testing tool (PerfRegress) • Integrate in Eclipse Parallel Tool Project (PTP)
Concluding Discussion • Performance tools must be used effectively • More intelligent performance systems for productive use • Evolve to application-specific performance technology • Deal with scale by “full range” performance exploration • Autonomic and integrated tools • Knowledge-based and knowledge-driven process • Performance observation methods do not necessarily need to change in a fundamental sense • More automatically controlled and efficiently use • Develop next-generation tools and deliver to community
Support Acknowledgements • Department of Energy (DOE) • Office of Science contracts • University of Utah ASCI Level 1 sub-contract • ASC/NNSA Level 3 contract • NSF • High-End Computing Grant • Research Centre Juelich • John von Neumann Institute • Dr. Bernd Mohr • Los Alamos National Laboratory