Download
1 / 48
490 likes | 834 Vues
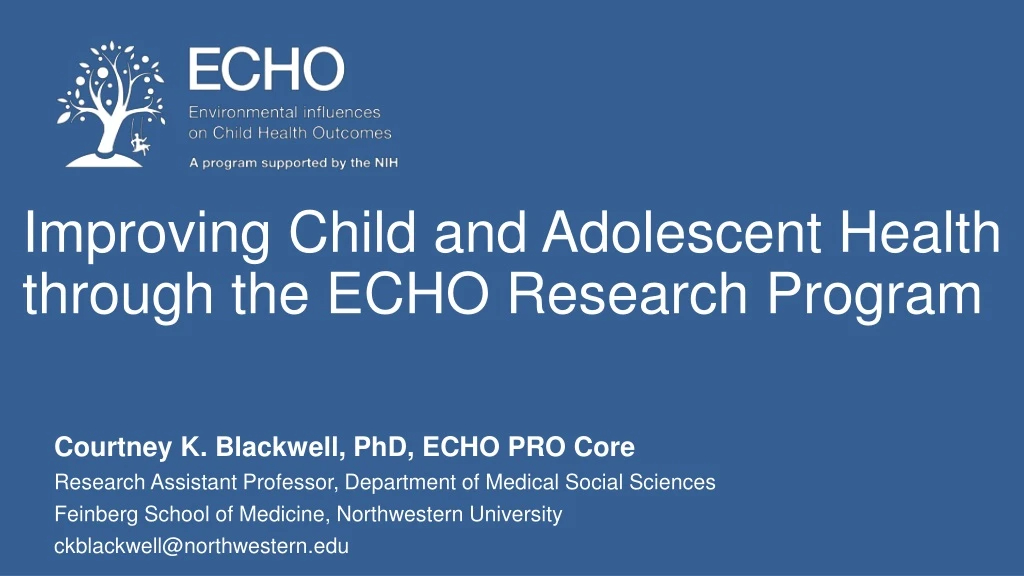
Improving Child and Adolescent Health through the ECHO Research Program. Courtney K. Blackwell, PhD, ECHO PRO Core Research Assistant Professor, Department of Medical Social Sciences Feinberg School of Medicine, Northwestern University ckblackwell@northwestern.edu. Conflict of Interest.

E N D
Improving Child and Adolescent Health through the ECHO Research Program Courtney K. Blackwell, PhD, ECHO PRO Core Research Assistant Professor, Department of Medical Social Sciences Feinberg School of Medicine, Northwestern University ckblackwell@northwestern.edu
Conflict of Interest • I have nothing to disclose.
An Overview: The Environmental influences on Child Health Outcomes (ECHO) Research Program • What: 7-year (2016-23) NIH-funded large research consortium of 84 existing longitudinal cohort studies representing 40 states and Puerto Rico, n~50,000 children • Objective: Leverage diverse cohorts to address a broad range of early environmental exposure effects on children’s health outcomes • How: Standardize new data collection through the ECHO-wide Protocol and harmonize existing measures • Purpose: Advance scientific understanding to inform high-impact programs, policies, and practices that improve the health of children and adolescents
ECHO Pediatric Cohorts N u mber of Cohorts • Recruited at different points in the life course • and different eras • with heterogeneity in retention, • different follow-up schedules, • and different measures. + • 35 Awards, 84 Cohorts, ~50,000 children
Environmental Exposures Physical & Chemical Air pollution, metal exposure, chemical toxicants Stress, maltreatment, neighborhood conditions Home Environment, Caregiver quality/behavior, Peer relationships Sleep, diet and nutrition, media Biospecimens (urine, blood, hair, toenails, saliva) Adapted from figure presented by M. Gillman at the Feb. 2017 ECHO Steering Committee meeting.
Child Health Outcomes NEURO-DEVELOPMENT UPPER AND LOWER AIRWAY OBESITY POSITIVE CHILD HEALTH PRE-, PERI- AND POSTNATAL
New Measure Development & Harmonization • Early Childhood PROMIS parent-proxy report measures • Developmental Extension of NIH Toolbox for differing abilities • Further validation of SRS-2 short form and development of CAT • Score-linking studies (e.g., CBCL with SDQ & BASC; PROMIS Depression with Edinburgh Postnatal Depression Scale) • Opportunities for new media measures and validation
Digital Media as an Exposure • Existing data primarily… • TV use • Media use in relation to sleep, mealtime, and/or sedentary behavior • New data primarily… • Media use across diverse devices/platforms • Media content, co-use, and relation to sleep
Technology as a Data Collection Tool: NIH Toolbox & PROMIS App • Tablet-based cognition tasks for 3+yr olds • Person-Reported Outcome (PROs) measures • Computer Adaptive Tests (CATs)
Technology as a Data Collection Tool: Accelerometers • ActiGraph to measure physical activity and sleep patterns for pregnant women & 2+yr old children • Worn on non-dominant wrist for 24 hours per day for 7 days + diary to track the date and time when device is taken off
Unique Data, Unique Questions • How can the large-scale, diverse, longitudinal nature of ECHO be leveraged to answer research questions that are otherwise unachievable through individual studies? What questions do YOU want answered? What topics are CRITICAL to explore?
Acknowledgements ECHO PRO Core MPIs David Cella, PhD & Richard Gershon, PhD Department of Medical Social Sciences Feinberg School of Medicine Northwestern University ECHO Data Analysis Center MPI Lisa Jacobson, ScD Bloomberg School of Public Health Johns Hopkins University MPI Corette Parker, DrPH RTI International Carol J. Blaisdell, MD Senior Program Officer, ECHO Program National Institutes of Health ECHO Coordinating Center MPIs Daniel Benjamin, MD, PhD, MPH & Brian Smith, MD Duke Clinical Research Center Duke University Matthew W. Gillman, MD Director, ECHO Program National Institutes of Health The ECHO Consortium
ECHO’s Structure Figure provided by the ECHO CC.
The Who: Age of “Existing” Children (N=47880, 79/84 cohorts) 10608 2 awards following 10-15% for new data collection Proportion 4025 3850 3228 2884 2751 2367 2347 1954 1837 1783 1592 1327 1296 1156 1151 1581 916 572 540 115 Age (years)
The Where: ECHO Pediatric Cohorts Cohort Prime Awardees Cohort Sub-Awardees Figure provided by the ECHO Coordinating Center (CC), originally presented by M. Gillman at the Feb. 2017 ECHO Steering Committee meeting.
The What: ECHO Child Outcome Focus Areas Neonatal/Infant Mortality+ Prematurity/Preg Outcomes Birth defects Social/Behav/Emot ADHD Autism Language Cognition Sleep Lung Function Allergy Asthma Obesity Physical Activity Nutrition Metabolic Risk Factors Diabetes • Pre/Peri/Postnatal – 57.8% • Neurodevelopment – 71.1% • Airways – 50.6% • Obesity-related – 51.8% • 46% of the cohorts are studying ≥ 3 ECHO outcome areas
The How: Operationalizing ECHO • Develop the ECHO-wide Cohort Data Collection Protocol • Standardize new data collection across all cohorts • Create the ECHO-wide Cohort Data Platform • Harmonized existing measures • Standardized new measures • Used by ECHO investigators & national research resource
Child Outcomes • Physical Health (e.g., anthropometry, ISAAC, body composition) • Neurodevelopment (e.g., developmental milestones, temperament, cognition, internalizing/externalizing, social cognition) • Social Role Performance/Functioning (e.g., peer relationships, academic performance) • Sleep Health (e.g., timing, duration, chronotype, quality, impairment) • Well-being (e.g., life satisfaction, meaning and purpose)
Methodology NATIONALLY-REPRESENTATIVE SURVEY OF 1,141 13-to-17 YEAR OLDS IN THE US • Age: 13- to 17-year-olds • Conducted March – April 2018 • Tracks changes from the first Common Sense report in 2012 to today • Social media = sites such as Instagram, Snapchat, or Facebook #socialmedialife #teens #DMDM2018 Source: Social Media, Social Life:Teens Reveal Their Experiences, 2018.
Methodology Strengths • Uses Address-Based Sampling • Households without Internet access are provided free tablets or laptops with Internet access for survey participation • Better external validity than non-probability sample
Methodology Limitations • Cross-sectional so demonstrating cause is not possible • Self-reports • Good for tracking, but not actually longitudinal • Non-response bias
Teens are connected 24/7 In 2012, 41% of teens had their own smartphones; in 2018, 89 % do.In 2012, 34% of teens checked social media several times a day; in 2018, 70% do. #socialmedialife #teens #DMDM2018 Source: Social Media, Social Life: Teens Reveal Their Experiences, 2018.
Teens have a mixed record when it comes to self-regulating their device use Among 13- to 17-year-olds with a cellphone, percent who say they turn off, silence, or put away their phones when: #socialmedialife #teens #DMDM2018 Source: Social Media, Social Life:Teens Reveal Their Experiences, 2018.
Teens say social media distracts them Among 13- to 17-year-olds, percent who agree that: #socialmedialife #teens #DMDM2018 Source: Social Media, Social Life:Teens Reveal Their Experiences, 2018. Note: Base varies by question
Teens prefer texting over talking face-to-face Among 13- to 17-year-olds, percent who say the following is their favorite way to communicate with friends: #socialmedialife #teens #DMDM2018 Source: Social Media, Social Life: Teens Reveal Their Experiences, 2018. Note: *Differences over time are significant at p < .05.
Teens say social media makes them feel better, not worse, about themselves Among 13- to 17-year-old social media users, percent who say using social media makes them feel: #socialmedialife #teens #DMDM2018 Note: All differences depicted in this chart are statistically significant at p < .05. Source: Social Media, Social Life: Teens Reveal Their Experiences, 2018.
For vulnerable teens, social media can have a more negative effect Vulnerable teens have more negative experiences on social media Among 13- to 17-year-old social media users, percent who say they: #socialmedialife #teens #DMDM2018 Source: Social Media, Social Life: Teens Reveal Their Experiences, 2018. Note: All differences between groups depicted in this chart are statistically significant at p < .05.
But even vulnerable teens say that social media has a positive rather than a negative effect on them overall * * Among low-SEWB+ 13- to 17-year-old social media users, percent who say using social media makes them feel: #socialmedialife #teens #DMDM2018 Source: Social Media, Social Life: Teens Reveal Their Experiences, 2018. + Social-emotional well-being. *Statistically significant compared to “more” at p < .05.
Customers Who Viewed This Item Also Viewed • Teens, Social Media & Technology (Pew Research Center, 2018) • Digital Health Practices, Social Media Use, and Mental Well-Being Among Teens and Young Adults in the U.S. (Hopelab, 2018) • Instagram and Snapchat are Most Popular Social Networks for Teens; Black Teens are Most Active on Social Media, Messaging Apps (AP-NORC, 2017)
ABCD Study Lindsay M. Squeglia, Ph.D. Medical University of South Carolina Site PI, Mobile Technology Co-Chair with Bernard Fuemmeler Wednesday, October 17, 2018
11,824 • 4,832 99.55% retention
Mobile Tech WG Goals and Priorities • Fitbit 3-week assessment @ Y2 • Assessing screen media activity • Parent & Youth questionnaire @ BL, Y1, Y2 • Via app: piloting • Social network involvement @ 3yr or 4yr? • Environmental sensors @ 3yr or 4yr? • Biosensors of substance use @ 4yr or 5yr • GPS location technology @ age 18? Bagot et al., 2018, DCN
Screen time Usage: Passive App • Data collection must be LOW BURDEN • Youth have a CHOICE as to what data we collect from them • PRIVACY is priority
Open Science Model • data-archive.nimh.nih.gov/
ABCD Team Here Today! Florence Breslin, MS, CCRP, LIBR Site Co-Investigator Bernard Fuemmeler, Ph.D., VCU, Mobile Technology Co-Chair Kara Bagot, M.D. UCSD, Staff Psychiatrist Katia Howlett, Ph.D. NIDA: Deputy Director Division of Extramural Research abcdstudy.org