Download
1 / 55
550 likes | 687 Vues
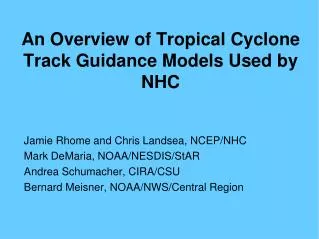
An Overview of Tropical Cyclone Track and Intensity Guidance Models Used by NHC. An Overview of NHC Guidance Models. GENERAL OBJECTIVES By the end of this module, you should be able to… Describe the spectrum of NHC TC track and intensity models

E N D
An Overview of Tropical Cyclone Track and Intensity Guidance Models Used by NHC
An Overview of NHC Guidance Models GENERAL OBJECTIVES By the end of this module, you should be able to… • Describe the spectrum of NHC TC track and intensity models • Describe the general strengths and weaknesses of each model • Give an example of each
Hierarchy of TC Track Models • Statistical • Forecasts based on established relationships between storm-specific information (i.e., location and time of year) and the behavior of previous storms • CLIPER • Statistical-Dynamical • Statistical models that use information from dynamical model output • NHC91 still maintains skill in the eastern Pacific • Simplified Dynamical • LBAR simple two-dimensional dynamical track prediction model that solves the shallow-water equations initialized with vertically averaged (850-200 hPa) winds and heights from the GFS global model • BAMD, BAMM, BAMS -> Forecasts based on simplified dynamic representation of interaction with vortex and prevailing flow (trajectory) • Dynamical Models • Solve the physical equations of motion that govern the atmosphere • GFDL, GFDN, GFS, NOGAPS, UKMET, ECMWF, NAM, HWRF • Ensemble Forecasts
Statistical: CLIPER (CLImatology and PERsistence Model • Statistical track model developed in 1972, extended to 120 h in 1998 • Required Input: • Current/12 h old speed/direction of motion • Current latitude/longitude • Julian Day, Storm maximum wind • Average 24, 48, 72, 96 and 120 h errors: 100, 216, 318, 419, and 510 nautical miles respectively • Used as a benchmark for other models and subjective forecasts; forecasts with errors greater than CLIPER are considered to have no skill.
Simplified Dynamical: Beta and Advection Model (BAM) • Method: Steering (trajectories) given by layer-averaged winds from a global model (horizontally smoothed to T25 resolution), plus a correction term to simulate the so-called “Beta Effect” • Three different layer averages: • Shallow (850-700 MB) - BAMS • Medium (850-400 MB) - BAMM • Deep (850-200 MB) - BAMD
DEEP MEDIUM SHALLOW L L L TROPICAL STORM / CAT. 1-2 HURRICANE MAJOR HURRICANE WHICH BAM TO USE? 200 mb Typical cruising altitude of commercial airplane 400 mb 700 mb Surface TROPICAL DEPRESSION 5,000 ft/850 mb
Simplified Dynamical: Limited-area BARotropic (LBAR) • Barotropic dynamics, i.e. 2-d motions – no temperature gradients or vertical shear • Lack of baroclinic forcing means the model has little or no skill beyond 1-2 days • Shallow water equations on Mercator projection solved using sine transforms • Initialized with 850-200 mb layer average winds/heights from NCEP global model (GFS) • Sum of idealized vortex and current motion vector added to large-scale analysis • Boundary conditions from global model
Primary Dynamical Models Used at NHC • U.S. NWS Global Forecast System (GFS) < relocates first-guess TC vortex • United Kingdom Met. Office (UKMET) < bogus (syn. data) • U.S. Navy Operational Global Atmospheric Prediction System (NOGAPS) < bogus (syn. data) • European Center for Medium-range Weather Forecasting (ECMWF) model (no bogus) • U.S. NWS Geophysical Fluid Dynamics Laboratory (GFDL) model <bogus (spinup vortex) • GFDN- Navy version of GFDL <bogus (spinup vortex) • HWRF
A Note on Bogussing • Since the globally analyzed vortex does not typically represent the structure of a true TC, “Bogussing” is often employed. • Bogussing involves an analysis of synthetic data to describe the TC vortex. • Bogussing can significantly affect the surrounding environment • vertical shear • Creating and inserting a bogus is not straight forward • Forecast can be very sensitive to small changes in the bogus storm • Bogus storms tend to be too resilient during ET • Bogus retains warm core too long leading to poor intensity and structure forecasts
The Global Forecast System (GFS) • Global spectral model • T382L64 (~ 35-km horizontal grid spacing with 64 vertical levels) through 180 hours. • T190L64 (~ 80-km grid spacing and 64 levels) 180-384 hours • Hybrid sigma-pressure vertical coordinate system (May 2007) • Simplified Arakawa-Schubert (SAS) convective parameterization scheme • PBL: First-order closure method • 3D-Var Gridpoint Statistical Interpolation (GSI) (May 2007) • Rather than bogussing, the GFS relocates the first-guess TC vortex to the official NHC position. • Often leads to an incomplete representation of the true TC structure • Run four times per day (00, 06, 12, and 18 UTC) out to 384 hours
The UK-Met Office Model • Non-hydrostatic global model • 4-D VAR analysis scheme with bogus TC • Arakawa C-grid: east-west horizontal grid spacing of 0.5 longitude and a north-south grid spacing of 0.4 latitiude (~40 km at mid-latitudes) • Hybrid vertical coordinate system with 50 levels • In 2002, completely new formulation including new dynamical core, fundamental equations, and physical parameterizations • Run twice daily at 0000Z and 1200Z producing forecasts for up to 144 hours (6 days) • Intermediate runs at 0600Z and 1800Z, but only product forecasts to 48 hours
NOGAPS Model • Global spectral model: T239L30 (approximately 55 km and 30 vertical levels) • Hybrid sigma-pressure vertical coordinate system ~ six terrain-following sigma levels below 850 mb and remaining 24 pressure levels occurring above 850 mb. • Time step is five minutes, but is reduced if necessary to prevent numerical instability associated with fast moving weather features. • 3-D VAR analysis scheme • Run 144 hours at each of the synoptic times. • Emanuel convective parameterization scheme with non-precipitating convective mixing based on the Tiedtke method. • Like other global models, the NOGAPS cannot provide skillful intensity forecasts but can provide skillful track forecasts.
ECMWF Model • Considered one of the most sophisticated and computationally expensive of all the global models currently used by the NHC. • Among the latest of all available dynamical model guidance. • Hydrostatic global model: T799L91 (approximately 25 km and 91 vertical levels) • Hybrid vertical coordinate system with as many levels in the lowest 1.5 km of the model atmosphere as in the highest 45 km. • (4-D Var) analysis scheme • Provides forecasts out to 240 hours (10 days). • Even though there is no bogussing or relocation (i.e. no specific treatment of TCs in the initialization), the model produces credible forecasts of TC track.
The Geophysical Fluid Dynamics Laboratory (GFDL) Hurricane Model • Only purely dynamical model capable of producing skillful intensity forecasts • Coupled with a high-resolution version of the Princeton Ocean Model (POM) (1/6° horizontal resolution with 23 vertical sigma levels) • Replaces the GFS vortex with an axisymmetric vortex spun up in a separate model simulation • Sigma vertical coordinate system with 42 vertical levels • Limited-area domain (not global) with 2 grids nested within the parent grid. • Outer grid spans 75°x75° at 1/2° resolution or approximately 30 km. • Middle grid spans 11°x11° at 1/6° resolution or approximately 15 km. • Inner grid spans 5°x5° at 1/12° resolution or approximately 7.5 km
The Hurricane Weather Research & Forecasting (HWRF) Prediction System • Next generation non-hydrostatic weather research and hurricane prediction system • Movable, 2- way nested grid (9km; 27km/42L; ~68X68) • Coupled with Princeton Ocean Model • 3-D VAR data assimilation scheme • But with more advanced data assimilation for hurricane core (make use of airborne doppler radar obs and land based radar) • Operational this season (under development since 2002) • Will run in parallel with the GFDL
“Late” versus “Early” • Models not available at synoptic time are known as “Late Models” • Dynamical models are not usually available until 4-6 hrs after the initial synoptic time (i.e., the 12Z run is not available until as late as ~18Z in real time) • Results must be interpolated to latest NHC position (GFDL GFDI, NGP NGPI, etc) • Models available shortly after synoptic time are known as “Early Models” • Late Models: GFS, UKMET, NOGAPS, GFDL, GFDN • Early Models: LBAR, BAM, AND CLIPER
Ensemble Forecasts (Classic Method) • A number of forecasts are made with a single model using perturbed initial conditions that represent the likely initial analysis error distribution • Each different model forecast is known as a “member model” • The spread of the various member models indicates uncertainty • small spread among the member model may imply high confidence • large spread among the member model may imply low confidence
Ensemble Forecasts (Multi-Model Method) • A group of forecast tracks from DIFFERENT PREDICTION MODELS (i.e. GFDL, UKMET, NOGAPS, ETC.) at the SAME INITIAL TIME • A multi-model ensemble is usually superior to an ensemble from a single model • different models typically have different biases, or random errors that will cancel or offset each other when combined. • The multi-model ensemble is often called a CONSENSUSforecast. • Primary Consensus forecasts used at NHC • GUNA • CONU • FSSE
Ensemble Forecasts (Multi-Model Method) • GUNA: a simple track consensus calculated by averaging the track guidance provided by the GFDI, UKMI, NGPI, and GFSI models. All four member models must be available to compute GUNA. • CONU: a simple track consensus calculated by averaging the track guidance provided by the GFDI, UKMI, NGPI, GFNI, and GFSI models. CONU only requires two of the five member models. • FSSE: The FSSE is not a simple average of the member models. Rather, the FSSE is constantly learning by using the performance of past member model forecasts along with the previous official NHC forecast in an effort to correct biases
Excellent example of GUNA consensus: HURRICANE ISABEL, 1200 UTC 11 SEP 2003
Florida State Super Ensemble • The limitation of such a technique occurs when the past performance of the member models does not accurately represent their present performance • For example, the FSSE may have to “relearn” a particular model’s bias at the beginning of a season, after changes were made to that member model
Corrected Consensus CONU and CCON Forecast Tracks Hurricane Daniel – 00Z 20 July 2006 • Derived statistically, based on parameters known at the start of the forecast, such as model spread, initial intensity, location, etc. • Can also be derived using historical biases of CONU or GUNA • Typically a small correction
Goerss Corrected Consensus CGUN 120 h FSP: 33% CCON 120 h FSP: 36% Small improvements of 1-3%, but benefits lost after 5 days
Types of TC Intensity Forecast Models • Statistical Models: SHIFOR (Statistical Hurricane Intensity FORecast). Based solely on historical information - climatology and persistence. (Analog to CLIPER.) • Statistical/Dynamical Models: SHIPS (Statistical Hurricane Intensity Prediction Scheme): Based on climatology, persistence, and statistical relationships to current and forecast environmental conditions. • Dynamical Models: GFDL, GFS, UKMET, NOGAPS. Based on the present and the future by solving the governing equations for the atmosphere (and ocean).
Statistical IntensityModelsSHIFOR (Statistical Hurricane Intensity FORecast) • Based solely on climatology and persistence • Originally developed in 1979 • Updated in 1988 • Completely revised in 2003 • Base Period 1967 – 1999 • Storms (35 kt or greater) at least 30 n mi. from land • Predictor Variables • Julian day • Initial intensity • Intensity change (last 12 hrs) • Initial storm latitude and longitude • Zonal and meridional storm motion (last 12 hrs)
Statistical/Dynamical Intensity ModelsSHIPS (Statistical Hurricane Intensity Prediction Scheme) • Based on climatology, persistence, and current/predicted environmental conditions. • DSHIPS (Decay SHIPS): same as SHIPS except when track forecast points are over land – when a decrease in intensity following an inland decay model is included. • DSHIPS modified to include information about oceanic heat content and inner core convection (using infrared satellite imagery).
The SHIPS Model Statistical multiple regression model relating tropical cyclone intensity change to various climatological, persistence, and environmental predictors. • (+) SST POTENTIAL (VMAX-V): Difference between the maximum potential intensity (depends on SST) and the current intensity. • (-) VERTICAL (850-200 MB) WIND SHEAR: Current and forecast. • (+) PERSISTENCE: If it’s been strengthening, it will probably continue to strengthen, and vice versa. • (-) UPPER LEVEL (200 MB) TEMPERATURE: Warm upper-level temperatures inhibit convection • (+) THETA-E EXCESS: Related to buoyancy (CAPE); more buoyancy is conducive to strengthening • (+) 500-300 MB LAYER AVERAGE RELATIVE HUMIDITY: Dry air at mid-levels inhibits strengthening
The SHIPS Model (Cont…) Statistical multiple regression model relating tropical cyclone intensity change to various climatological, persistence, and environmental predictors. • (+) 850 MB ENVIRONMENTAL RELATIVE VORTICITY: Vorticity is averaged over a large area, about 10° radius. Intensification is favored when the storm is in an environment of cyclonic low-level vorticity. • (-) ZONAL STORM MOTION: Intensification is favored when TCs are moving west • (-) STEERING LEVEL PRESSURE: intensification is favored for storms that are moving more with the upper level flow. This predictor usually only comes into play when storms get sheared off and move with the flow at very low levels (in which case they are likely to weaken). • (+) 200 MB DIVERGENCE: Divergence aloft enhances outflow and promotes strengthening • (-) CLIMATOLOGY: Number of days from the climatological peak of the hurricane season
Satellite/Oceanic Predictors have been added to SHIPS • GOES cold IR pixel count 3. Oceanic heat content from • GOES IR Tb standard deviation satellite altimetry • (TPC/UM algorithm)
A STATISTICAL TECHNIQUE TO AID IN THE FORECAST OF RAPID INTENSIFICATION: The 7 predictors used to estimate the probability of Rapid Intensification (defined as an increase in maximum wind speed of at least 25 kt over 24 h):
Example of Rapid Intensification Index • Wilma, 10/19/05
Example of Rapid Intensification Index Cont… VERIFYING: 160 KNOTS
Dynamical Intensity Models • GFDL, NCEP Global Model (GFS), UKMET (U.K. Met Office), NOGAPS (U.S. Navy), ECMWF (European) • These models are of limited use, because of… • sparse observations • inadequate resolution (need to go down to a few km grid spacing; the GFDL, our highest-resolution operational hurricane model, is currently about 18 km) • incomplete understanding and simulation of basic physics of intensity change • biases in upper-level wind forecasts.
GFDL INTENSITY FORECASTS FOR KATRINA DID SHOW STRENGTHENING TO A MAJOR HURRICANE OVER THE GULF
GFDL FORECAST FROM 10/17/05 18Z OBSERVED Early on 19 October, Wilma deepened at a rate of ~ 10 mb/hr! GFDL MODEL DID CAPTURE SOME OF WILMA’S RAPID DEEPENING