Download
1 / 27
270 likes | 354 Vues
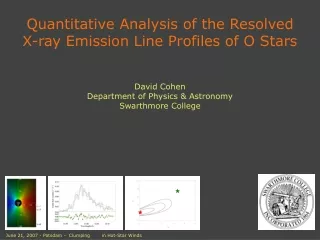
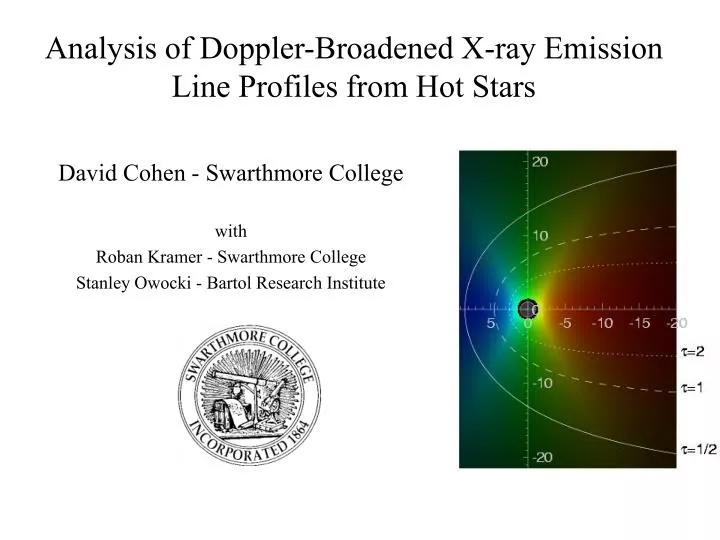
Analysis of Doppler-Broadened X-ray Emission Line Profiles from Hot Stars. David Cohen - Swarthmore College with Roban Kramer - Swarthmore College Stanley Owocki - Bartol Research Institute. Outline. 0. The astrophysical context I. Introduction: What line profiles can tell us

E N D
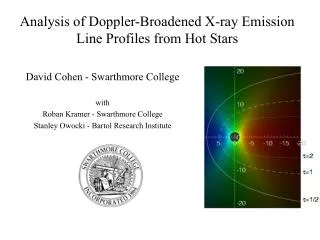
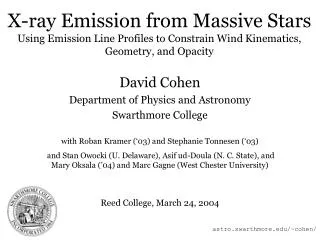
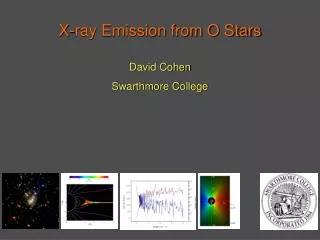
Analysis of Doppler-Broadened X-ray Emission Line Profiles from Hot Stars David Cohen - Swarthmore College with Roban Kramer - Swarthmore College Stanley Owocki - Bartol Research Institute
Outline 0. The astrophysical context I. Introduction: What line profiles can tell us II. The basic model III. Fitting Chandra data from hot stars - z Pup: Constraining parameters IV. What the data are telling us: Integration with other X-ray spectral diagnostics
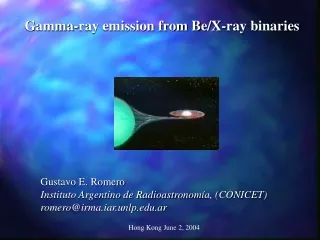
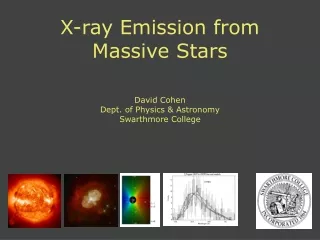
What produces hot-star X-rays? Hot stars are thought not to have convective envelopes, magnetic activity, or coronae Hot stars have massive radiation-driven winds, with a significant amount of continuum opacity
What Line Profiles Can Tell Us • The wavelength of an emitted photon is proportional to the line-of-sight velocity: • Line shape maps emission measure at each velocity/wavelength interval • Continuum absorption by the cold stellar wind affects the line shape • Correlation between line-of-sight velocity and absorption optical depth will cause asymmetries in emission lines X-ray line profiles can provide the most direct observational constraints on the X-ray production mechanism in hot stars
Emission Profiles from a Spherically Symmetric, Expanding Medium A spherically-symmetric, X-ray emitting wind can be built up from a series of concentric shells. Occultation by the star removes red photons, making the profile asymmetric A uniform shell gives a rectangular profile.
Continuum Absorption Acts Like Occultation Red photons are preferentially absorbed, making the line asymmetric: The peak is shifted to the blue, and the red wing becomes much less steep.
We calculate line profiles using a 4-parameter model 3 parameters describe the spatial and velocity distribution of the emission: Ro is the minimum radius of X-ray emission; b describes the acceleration of the wind; q parameterizes the radial dependence of the filling factor. 1 parameter, t*, describes the level of continuum absorption in the overlying wind. A wind terminal velocity is assumed based on UV observations, and the calculated line profile is convolved with the appropriate instrument-response function for each line.
In addition to the wind-shock model, our empirical line profile model can also describe a corona With most of the emission concentrated near the photosphere and with very little acceleration, the coronal line profiles are very narrow.
t=1,2,8 A wide variety of wind-shock characteristics can be modeled Ro=1.5 Line profiles change in characteristic ways with t* and Ro, becoming broader and more skewed with increasing t* and broader and more flat-topped with increasing Ro. Ro=3 Ro=10
The X-ray lines in O stars are observed to be broad; z Pup is the prototypical O supergiant with a strong wind Ne X Fe XVII N VII O VIII We fit six lines in the Chandra MEG spectrum of z Pup
For each line, we are able to achieve a good fit with reasonable model parameters blend Best-fit model: t=1.0, Ro=1.4, q=-0.4, with b=1 fixed
We also determine the extent of the confidence limits within the model parameter space – Note how the line profile changes with increasing wind opacity 68% 95% 99% t increasing t increasing
The fitted lines span a range of wind optical depth and X-ray temperature The Fe XVII line at 15 Å (left) has a more typical profile, while the N VII (right) is more flat-topped and broad. And despite having a longer wavelength, it doesn’t suffer a lot of attenuation.
The confidence regions define the widest possible variation among acceptable models highest t best fit model lowest t The best fit and two other acceptable (at the 95% confidence level) fits
The best-fit parameters and 95% confidence limits are derived for all six lines The formation radii for all lines are close to the surface of the star
Wind optical depth is only moderate, and only varies weakly with wavelength
Discussion • A spherically symmetric, distributed wind X-ray source (i.e. ‘wind shock model’) can account for the line profiles in z Pup in a reasonable way • The X-ray formation zone begins close to the photosphere (within 3 R for all lines) • Continuum absorption by the overlying cool wind is important, but not as strong as models (and UV observations of the wind) would seem to suggest (t is between 8 and 20 according to models calculated by Hillier et al. (1993)).
more Discussion… • Above Ro, the amount of X-ray emitting gas scales close to density-squared (i.e. the filling factor has very little radial dependence) • The lower-than-expected absorption could have to do with overestimation of the wind opacity, or possibly with overestimation of the mass-loss rate…but, it could also be due to clumping in the wind (which might also be associated with the wind-shock process itself) • Other O stars observed with Chandra do not seem to have wind absorption signatures (broad but symmetric lines) and B stars have basically narrow lines – could this have to do with clumping too? Or non-spherical winds? (see Owocki’s poster on MHD simulations of magnetic hot star winds)
Rad-hydro simulations of the line-force instability – copius shock-heated material distributed throughout the wind
for The Basic Model Described in Owocki & Cohen (2001, ApJ, 559, 1108), the model assumes a smoothly and spherically symmetrically distributed accelerating X-ray emitting plasma subject to continuum attenuation by the cold stellar wind. which dictates the density of the wind as well. The wind velocity is assumed to have the form: The optical depth of the wind along a ray with impact parameter p is given by: where Note that while spherical symmetry is natural for the emission, cylindrical symmetry is natural for the absorption; Combining expressions in these two sets of variables requires the transformation: Ro parameterizes the lower radius of X-ray emission The delta function picks out the resonance velocity, mapping m into l. q parameterizes the radial fall-off of the emissivity.