Download
1 / 14
383 likes | 957 Vues
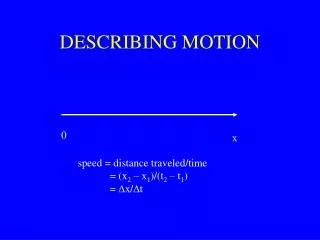
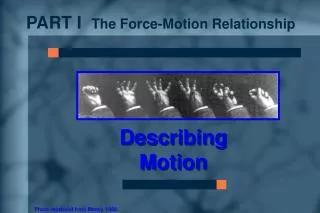
Describing Motion with Diagrams. Describing Motion with Diagrams. Ticker Tape Diagrams. Ticker Tape Diagrams. The distance between dots represents the object’s change in position during that time interval. Ticker Tape Diagram.

E N D
Describing Motion with Diagrams • Ticker Tape Diagrams
Ticker Tape Diagrams The distance between dots represents the object’s change in position during that time interval
Ticker Tape Diagram A changing distance between dots indicates a changing velocity – acceleration
Graphing Motion ZERO MOTION The object is at rest Position-time graph (x vs t) position of an object remains constant over time Velocity-time graph (v vs t) object is not moving, it has 0 velocity Acceleration-time graph (a vs t) If the object’s velocity is not changing, its acceleration is 0 Sketch above graphs
Graphing Motion Uniform Motion – Constant Velocity x vs t graph as time increases so does the position *slope of a x vs t graph = velocity v vs t graph velocity remains constant over time *this should reflect the value of the slope of the x vs t graph a vs t graph velocity is not changing, acceleration is 0 *slope of a v vs t graph is acceleration
Graphing Motion Uniform Accelerated Motion x vs t graph – position is increasing exponentially with time (acceleration) v vs t graph – velocity is increasing with time (acceleration) a vs t graph – acceleration is constant. • The value of a is equal to the slope of the v vs t graph • Acceleration will always be a horizontal line
Position time graph x Tangent Lines t On a position vs. time graph:
Position time graph x t Increasing & Decreasing Increasing Decreasing On a position vs. time graph: Increasing means moving forward (positive direction). Decreasing means moving backwards (negative direction).
Position time graph x t Concavity On a position vs. time graph: Concave up means positive acceleration. Concave down means negative acceleration.
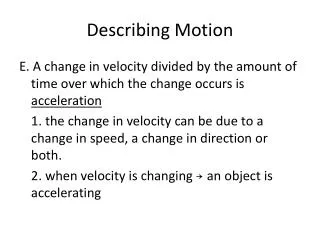
Describe the motion • This object is moving in the positive direction and accelerating in the positive direction (speeding up). • This object is moving in the negative direction and accelerating in the negative direction (speeding up). • This object is moving in the negative direction and accelerating in the positive direction (slowing down).
Area under a v vs t graph The area of a v vs t graph is displacement