Download
1 / 29
300 likes | 415 Vues
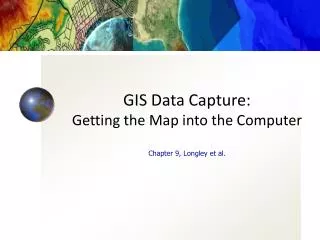
GIS DATA SOURCES Getting maps into the Computer Adding Data from existing tables. Tables. The ‘data base’ part of GIS as a relational database management system

E N D
GIS DATA SOURCESGetting maps into the ComputerAdding Data from existing tables
Tables.... • The ‘data base’ part of GIS as a relational database management system • A spreadsheet is how most people see a table... And indeed Excel (the most common spreadsheet program) can easily provide data to the ArcGIS or ArcView
Sample of tabular data...the database for a TIGER roads file
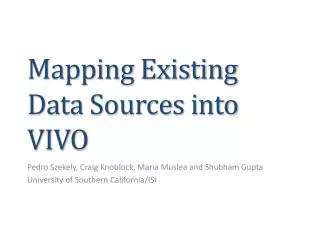
Combining tabular data with Spatial Data • There are incredible amounts of attribute data available in digital format. • Virtually any tabular data can be used in conjunction with the GIS. • Some sort of spatial ‘hook’ is required: - a street address - XY coordinates (Lat/Long) - a country/state/county/tract identification • Many data sets are not developed to be ‘spatial’… but the spatial component can be very enlightening….
http://www.usatoday.com/news/vote2000/cbc/map.htm A classic example of spatial patterns derived from data that is commonly considered “non-spatial”
2004 Election Results http://www.usatoday.com/news/politicselections/vote2004/countymap.htm
Even years later, the RED-BLUE designations persist in the American political lexicon
Red or Blue—Which Are You?By Anne E. Kornblut, Slate Magazine 2004 • “... Red and blue are states of mind, not actual states. ... It's not as simple as liberal vs. conservative, elite vs. populist, urban vs. rural, religious vs. nonreligious, educated vs. uneducated, rich vs. poor—if it were, the terms "red" and "blue" wouldn't have taken off as the best shorthand for a divided America....” • http://slate.msn.com/id/2103764/
Sources of Data … • Virtually endless… even if the data are not ‘available’ in digital form… the use of copy/paste can be used to grab the data… • US Census (virtually everything about the US population!) • USDA (Agricultural stats for the US) • UN-FAO (forestry/agriculture/population)
U.S. Census Bureau http://www.census.gov/main/www/cen2000.html(can be a difficult site to navigate)
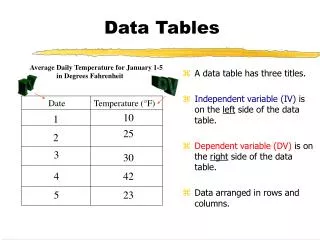
Problems? • Often the data are of a different ‘type’: while the join tool in Arcview is fairly robust, the items to be joined must be of the same type. e.g. number vs. text items. • Number items are right justified, text items are left justified. Even though a ‘number’ can appear as 2034, it may be a ‘text string’ rather than a number.
Number items Same field as ‘text’
Fixing the mixed type problem: • Within a spreadsheet program, such as Excel, convert the data type • Within Arcview, add a new field to a table and use the ‘calculate’ function to convert to a number field.
In Arcview, add a new field. ‘calculate’ that field to be the old field with using an operator that converts the text string to a number field.
Note: the field type can be number or a character string IF you need decimal places, specify them here, the default value is 0
Creating ‘new’ data in a table • ArcGIS (and Arcview) can be used to manipulate the data in a table to create ‘new’ data relationships • e.g. population change If asked to calculate the change in population, it is fairly simple to add a new field and calculate the value for this ‘new’ information
Under the options pulldown you will find the option to create a new data field
Name the new field and choose its properties Make sure the field is long enough to store the data... For example: You cannot go back and change a text field that you set to hold 6 characters to change and hold ‘MISSISSIPPI’
Right click on the name of the new field, choose calculate new values. The field will equal whatever expression you create in the box In this example, I have calculated the % population change between 1990 and 1999 Make sure the number of () is correct for the expression
To review : calculating a field value.... The ADVANCED Button allows you to enter a VB (visual basic) expression
Cardinality: these relationships allow data tables to be joined (a single table is created)
One to many: this situation requires a relate rather than joining tables. When tables are related, the related items of a selected item (in another table) are highlighted (the tables remain separate)
XY ‘events’...Data from the GPS • Adding x,y coordinate data to a map • Click the Tools menu and click Add XY Data. • Click the table dropdown arrow and click a table that contains x,y coordinate data. If the table is not on the map, click the Browse button to access it from disk. • Click the X Field dropdown arrow and click the field containing x-coordinate values. • Click the Y Field dropdown arrow and click the field containing y-coordinate values. • Click Edit to define the coordinate system and units represented in the x and y fields. • The x,y coordinates will be automatically transformed to match the coordinate system of the data frame. • Tip • To add x,y data, your coordinates need to be in the projected units or decimal degrees.
Getting GPS data into the GIS..... My favorite tool works with Garmin GPS devices . It is a free tool developed by the Minnesota Dept. of Natural Resources. http://www.dnr.state.mn.us/mis/gis/tools/arcview/extensions/DNRGarmin/DNRGarmin.html It is an Arcview extension, that has a standalone VB program that will allow you to download the data from a Garmin GPS to a table format.