Download
1 / 28
280 likes | 284 Vues
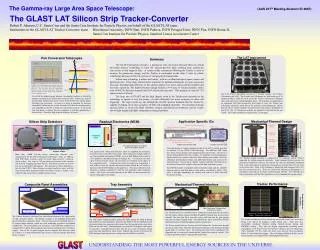
Thermal Performance of the GLAST LAT Tracker. Silvia Rainò INFN-Bari For the Italian GLAST Tracker Collaboration. Outline. The GLAST (Gamma Ray Large Area Space Telescope) Instrument Environmental Tests on the LAT (Large Area Telescope) Tracker: Thermal-Vacuum Test Results

E N D
Thermal Performance of the GLAST LAT Tracker Silvia Rainò INFN-Bari For the Italian GLAST Tracker Collaboration Silvia Rainò - 9th IPRD- Siena, 23rd-26th May 2004
Outline • The GLAST (Gamma Ray Large Area Space Telescope) Instrument • Environmental Tests on the LAT (Large Area Telescope) Tracker: Thermal-Vacuum Test Results • Dependence of the Silicon Detectors Performance on Temperature Silvia Rainò - 9th IPRD- Siena, 23rd-26th May 2004
Gamma Ray Burst Monitor (GBM) Large Area Telescope (LAT) Spacecraft The GLAST Observatory Launch Vehicle Delta II – 2920-10H Launch Location Kennedy Space Center Orbit Altitude 575 Km Orbit Inclination 28.5 degrees Orbit Period 95 Minutes Orientation +X to the Sun Silvia Rainò - 9th IPRD- Siena, 23rd-26th May 2004
The LAT Instruments Tracker GLAST-LAT Performance Tracker Aeff ≈ 8000 cm2 (E > 100 MeV) Angular Res. < 3.50 @ E=100 MeV < 0.150 @ E>10 GeV F.O.V. ≈ 2.4 sr Source Loc. < 0.5’ Energy Resolution < 10% Dead time < 100 s Time Res. ≈ 2 s Power 500 W Grid Thermal Blanket ACD DAQ Electronics Calorimeter Systems work together to identify and measure the flux of cosmic gamma rays with energy 20 MeV ->300 GeV. Silvia Rainò - 9th IPRD- Siena, 23rd-26th May 2004
g Multi-Chip Electronics Module (MCM) Carbon fiber side-walls e- e+ Titanium flexures Read-out cable The GLAST LAT Tracker • 16 towers in a 4 4 array • 19 stacked carbon fiber panels: trays • 18 x,y alternated planes/tower • W converter (12 3% r.l., 4 18% r.l.) • 2mm gap between x/y oriented SSDs • 37cm 37cm of active cross section • 83 m2 of Si • 11500 SSD, ~ 1M channels Silvia Rainò - 9th IPRD- Siena, 23rd-26th May 2004
EM Tower final assembly steps Tray Panel Tungsten The tray box SSDs MCM Flex cables with thermistors TKR Pictures Silvia Rainò - 9th IPRD- Siena, 23rd-26th May 2004
SSD Procurement, Testing SLAC,Japan, Italy (HPK) Module Structure Components SLAC: Ti parts, thermal straps, fasteners. Italy (Plyform): Sidewalls SSD Ladder Assembly Italy (G&A, Mipot) 18 10,368 Tracker Module Environmental Tests Italy (Alenia Spazio) 342 2592 Tray Assembly and Test Italy (G&A) 342 Electronics Fabrication, burn-in, & Test UCSC, SLAC (Teledyne) 648 Composite Panel, Converters, and Bias Circuits Italy (Plyform): fabrication SLAC: CC, bias circuits, thick W, Al cores Readout Cables UCSC, SLAC (Parlex) Tracker detector: construction work-flow Silvia Rainò - 9th IPRD- Siena, 23rd-26th May 2004
Environmental Tests on TKR Aim of the Environmental Tests on the GLAST TKR Towers is mainly to verify the capability to withstand the conditions expected during launch phases (mechanical tests) and on orbit (thermal/thermal-vacuum tests) Trays Vibration tests & thermal cycles Vibration tests Towers Thermal vacuum cycles: thermal balance This presentation focuses on the results of the THERMAL BALANCE TEST on the EM Tower and on the expected thermal performance of the GLAST Tracker Silvia Rainò - 9th IPRD- Siena, 23rd-26th May 2004
EM-Tower: Thermal-balance test Temperature measurements: Thermocouples: 100 placed throughout the tower and MGSE Thermistors: 16 placed two per each flex cable Action: measure the temperature distribution in the tower under predicted orbital operating conditions, by using a combination of 3 tracker power levels (8,10,12 W) and 3 controlled base plate temperatures (20, 0, -15°C). Goal: Correlate GLAST EM TKR Tower internal temperatures with those measured by the Tower cable thermistors and also with those predicted by the Tower thermal math model. Silvia Rainò - 9th IPRD- Siena, 23rd-26th May 2004
TCs Test Set-up Guard shield over the the tower + MLI blanket system to prevent heat losses Thermocouples on the side-walls of the tower MLI blanket covers the tower Silvia Rainò - 9th IPRD- Siena, 23rd-26th May 2004
Tower Electronics Module … in the thermal-vacuum chamber Thermal vacuum chamber in Alenia AIT - Rome Silvia Rainò - 9th IPRD- Siena, 23rd-26th May 2004
Start flooding shrouds with LN2 (T=81 K) Recovery 25°C 12W 8W HOT BALANCE 20°C 12W Pump down (p=10-6 torr) 10W 8W MID BALANCE 0°C 12W 10W Clean room temperature 22°C LOW BALANCE -15°C Thermal Balance Test Profile Silvia Rainò - 9th IPRD- Siena, 23rd-26th May 2004
TB1 TB6 TB3 TB4 TB5 TB7 TB2 Node 1: tray 18 (top) Node 2: trays 12/13/14/15/16/17 Node 3: trays 6/7/8/9/10/11 Node 4:trays 3/4/5 Node 5: trays 1/2 Node 6: tray 0 (bottom) TB Test Results -1 The temperature distribution along the tower has been studied dividing it into six nodes. This division allows to create a correlation of the experimental results with the math model. Balance condition: < 0.2°C/hr Balance duration: 4hr Silvia Rainò - 9th IPRD- Siena, 23rd-26th May 2004
TB Test Results - 2 Thermistors vs. thermocouples Thermocouples (continuous) and thermistors (dashed) Silvia Rainò - 9th IPRD- Siena, 23rd-26th May 2004
TB Test Results -3 Average Temperature for each node at the different balance cases T 5 6.5°C between top and bottom trays of the tower -15 °C 0 °C 20 °C Silvia Rainò - 9th IPRD- Siena, 23rd-26th May 2004
GLAST TKR Silicon Detectors Performance Signal/Noise dependence on temperature Silvia Rainò - 9th IPRD- Siena, 23rd-26th May 2004
SSDs performance simulation A Monte Carlo Code, developed to simulate all the physical processes that occur in Silicon Strip detectors, has been used to evaluate the total number of electron-hole pairs in silicon produced by a MIP, as a function of temperature. The number of e-h pairs has been estimated as a function of temperature. Since Egap slightly decreases as the temperature increases the total number of charge carriers in silicon slightly increases with the temperature. (more details in F.Loparco’s talk… yesterday) Silvia Rainò - 9th IPRD- Siena, 23rd-26th May 2004
Most probable number of e-h pairs Average number of e-h pairs Pair Production vs Temperature e-h pairs distributions have been fitted with a Landau function Silvia Rainò - 9th IPRD- Siena, 23rd-26th May 2004
Shot noise due to the leakage current: i2nd=2eIL Noise sources Thermal noise due to the feedback resistor: i2nf=4KT/Rf S H A P E R Electronic noise due to the 1st stage of the pre-amplifier: i2na= 0 v2na = 2.7KT/gm+Af/f Thermal noise due to the bias resistor: i2nb=4KT/Rb Silvia Rainò - 9th IPRD- Siena, 23rd-26th May 2004
V* Vpre Vout H1 Hshaper H2 Hshaper Rfs Rf Cf Cc Cfs gm Id gms Rd Cd detector charge-preamplifier shaper RMS Noise Voltage At the shaper output, the rms noise voltage is H2=Vpre/V* Hshaper=Vout/Vpre H1=Vpre/Id Hshaper=Vout/Vpre Silvia Rainò - 9th IPRD- Siena, 23rd-26th May 2004
ENC=1500e- @ T=300K Noise temperature dependence ENC evaluated from the rms noise voltage assuming a front-end overall gain of 115 mV/fC Silvia Rainò - 9th IPRD- Siena, 23rd-26th May 2004
Signal/Noise vs Temperature The signal to noise ratio (S/N) has been evaluated as the ratio between the most probable/average number of electron-hole pairs and ENC. S/N 21.5 @ 300 K MIPs crossing 400 m thick Si S/N 19 @ 300 K Silvia Rainò - 9th IPRD- Siena, 23rd-26th May 2004
Conclusions • A detailed study of the mechanical and thermal performance of the GLAST TKR has been done on an Engineering Model Tower before the beginning of the flight production started in April 2004. • The results of the Thermal Balance Test have been presented: an average temperature gradient of ≈6°C between the top and bottom of the tower has been found at a nominal tower power level of 10 W confirming the results of the thermal math model • The dependence of the detectors performance on the temperature has been studied, by using a Monte Carlo code developed to fully simulate the silicon detector performance. • In order to understand the overall performance of the TKR, a complete simulation taking into account the strip geometry, the charge sharing, the impact angles of particles, …. is needed (see M.Brigida talk) Silvia Rainò - 9th IPRD- Siena, 23rd-26th May 2004
2007 Silvia Rainò - 9th IPRD- Siena, 23rd-26th May 2004
SSDs Bias-Circuit Gr/CE Face Sheet Tray panel Structural Panel Converter Foils Bias-Circuit C-C Structural Closeout Wall Thermal Boss TMCM SSDs 1 lb/ft3 Aluminum Honeycomb Core C-C MCM Closeout Wall Tracker Trays Silvia Rainò - 9th IPRD- Siena, 23rd-26th May 2004
End of Mission expectations At the end of mission a total dose of 5 krad (a factor 5 engineering margin is considered); the leakage current per strip increases to Il=94 nA at T0=298 K. ENC 2000 e- @ 300K The S/N ratio decreases from 20 at 250 K to about 4 at 350 K. Silvia Rainò - 9th IPRD- Siena, 23rd-26th May 2004
Simulation Parameters • Some Parameters used for the SSDs simulation: • Il=1.5nA/strip @ 296K • Cd=47nF • Rb=40M • Rf=10G • Af=310-12V2 • gm=0.7mS Silvia Rainò - 9th IPRD- Siena, 23rd-26th May 2004
Front-end electronics Preamplifier Shaper Detector Silvia Rainò - 9th IPRD- Siena, 23rd-26th May 2004