Download
1 / 7
70 likes | 82 Vues
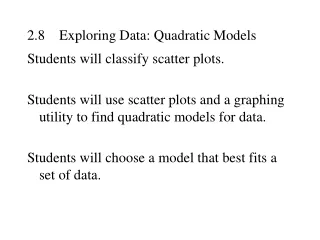
1.8 Quadratic Models. Ex. 1. Steps on a TI Calculator. Go to STAT and choose Edit Put in your values for L1(x) and L2(y) Go to STAT PLOT Turn PLOT “on” and choose Scatter-Plot Go to STAT and choose CALC Choose the regression (regressions below) that you would like to draw

E N D
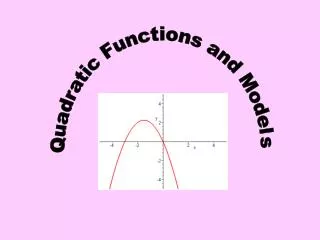
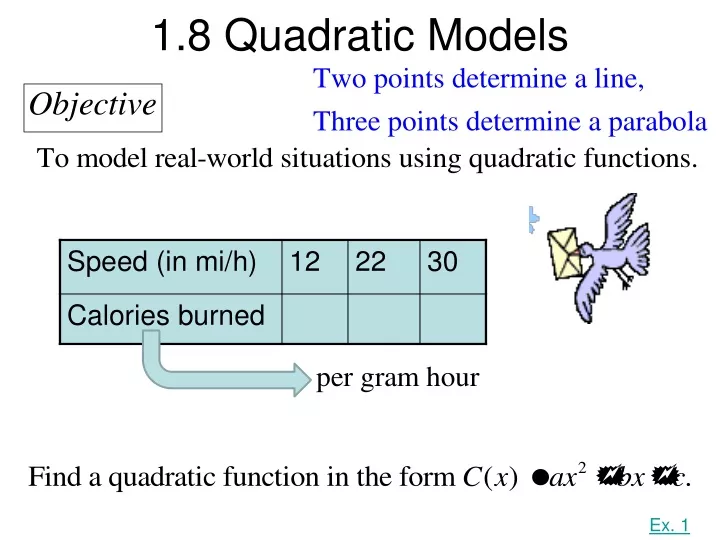
1.8 Quadratic Models Ex. 1
Steps on a TI Calculator • Go to STAT and choose Edit • Put in your values for L1(x) and L2(y) • Go to STAT PLOT • Turn PLOT “on” and choose Scatter-Plot • Go to STAT and choose CALC • Choose the regression (regressions below) that you would like to draw • To graph, change your window to fit your data LinReg = Linear Regression QuadReg = Quadratic Regression CubicReg = Cubic Regression ExpReg = Exponential Regression PwrReg = Power Regression SinReg = Sine Regression
Model a real-world problem with a quadratic function and use the model to find a maximum or a minimum.
Model a real-world problem with a quadratic function and use the model to find a maximum or a minimum.