Download
1 / 96
980 likes | 1.47k Vues
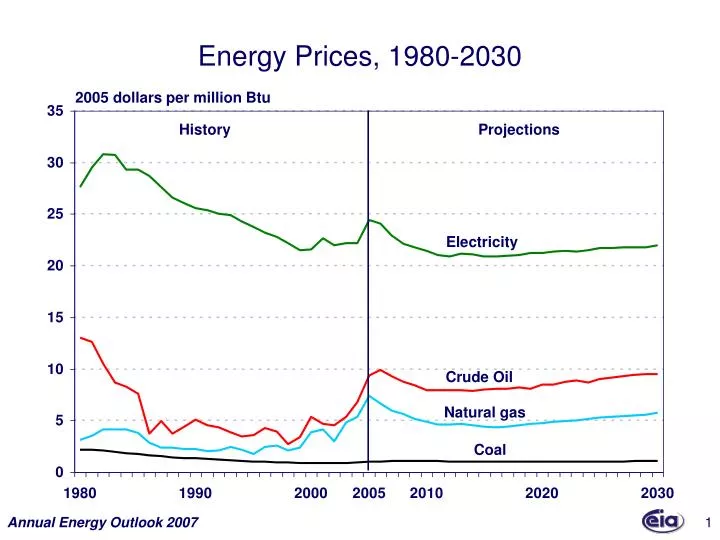
Energy Prices, 1980-2030. 2005 dollars per million Btu. History. Projections. Electricity. Crude Oil. Natural gas. Coal. Delivered Energy Consumption by Sector, 1980-2030. quadrillion Btu. Transportation. Industrial. Residential. Commercial. History. Projections.

E N D
Energy Prices, 1980-2030 2005 dollars per million Btu History Projections Electricity Crude Oil Natural gas Coal Annual Energy Outlook 2007
Delivered Energy Consumption by Sector, 1980-2030 quadrillion Btu Transportation Industrial Residential Commercial History Projections Annual Energy Outlook 2007
Energy Consumption by Fuel, 1980-2030 quadrillion Btu History Projections Petroleum Coal Natural Gas Nuclear Nonhydro renewables Hydropower Annual Energy Outlook 2007
Energy Use per Capita and per Dollar of Gross Domestic Product, 1980-2030 index, 1980 = 1 Energy use per capita Energy use per dollar GDP History Projections Annual Energy Outlook 2007
Electricity Generation by Fuel, 1980-2030 billion kilowatthours History Projections 5,478 Coal 2,094 Electricity Demand Natural gas Nuclear Renewables Petroleum Annual Energy Outlook 2007
Total Energy Production and Consumption, 1980-2030 quadrillion Btu History Projections Net imports Consumption Production Annual Energy Outlook 2007
Energy Production by Fuel, 1980-2030 quadrillion Btu History Projections Coal Natural gas Petroleum Nuclear Nonhydro renewables Hydropower Annual Energy Outlook 2007
U.S. Carbon Dioxide Emissions by Sector and Fuel,1990-2030 million metric tons Transportation Coal Industrial Natural gas Commercial Petroleum Residential 1990 2005 2010 2030 2020 Annual Energy Outlook 2007
Reformed CAFE Standards (miles per gallon) for Light Trucks by Model Year and Vehicle Footprint (square feet) miles per gallon Annual Energy Outlook 2007
World Oil Prices in Three Cases, 1990-2030 2005 dollars per barrel High Price Reference Low Price History Projections Annual Energy Outlook 2007
Changes in Construction Commodity Costs,1973-2006 constant dollar index, 1973=100; 1981=100 for cement costs Iron and Steel Construction Commodities Composite Concrete Products Cement Annual Energy Outlook 2007
Drilling Costs for Onshore Natural Gas Development Wells at Depths of 7,500 to 9,999 Feet, 1996-2004 2004 dollars per well Average Median Annual Energy Outlook 2007
Change in Iron and Steel, Mining Equipment and Machinery, and Railroad Equipment Costs, 1973-2006 constant dollar index, 1973=100 Mining Equipment and Machinery Railroad Equipment Iron and Steel Annual Energy Outlook 2007
Changes in Construction Commodity Costs and Electric Utility Construction Costs, 1973-2006 constant dollar index, 1973=100 Electric Utility Construction Construction Commodities Composite Annual Energy Outlook 2007
Additions to Electricity Generation Capacity in the Electric Power Sector, 1990-2030 gigawatts of net summer capacity Annual Energy Outlook 2007
Energy Intensity of Industry Subgroups in the Metal-Based Durables Group of Manufacturing Industries, 2002 Electricity Natural Gas thousand Btu per 2000 dollar value of shipments Annual Energy Outlook 2007
Average Annual Growth Rates of Value of Shipments for Metal-Based Durables Industries in the AEO2006 and AEO2007 Reference Case Projections, 2005-2030 AEO2006 AEO2007 percent per year Annual Energy Outlook 2007
Average Annual Increases in Energy Demand for Metal-Based Durables Industries in the AEO2006 and AEO2007 Reference Case Projections, 2005-2030 AEO2006 AEO2007 percent per year Annual Energy Outlook 2007
Annual Delivered Energy Demand for the Non-Energy-Intensive Manufacturing Industry Groups in the AEO2006 and AEO2007 Reference Case Projections, 2005-2030 trillion Btu AEO2006 Other Non-Energy-Intensive AEO2007 AEO2006 Metal-Based Durables AEO2007 Annual Energy Outlook 2007
Lower 48 Offshore Crude Oil Production in Two Cases, 1990-2030 million barrels per day Outer Continental Shelf Access Case Reference Case History Projections Annual Energy Outlook 2007
Lower 48 Offshore Natural Gas Production in Two Cases, 1990-2030 trillion cubic feet Outer Continental Shelf Access Case Reference Case History Projections Annual Energy Outlook 2007
U.S. Ethanol Production and Production Capacity, 1999-2007 billion gallons Production Capacity Consumption Under Construction August 2006 Annual Energy Outlook 2007
Average U.S. Prices for Ethanol and Gasoline,2003-2006 nominal cents per gallon Ethanol without Blender’s Tax Credit Unleaded Motor Gasoline Ethanol with Blender’s Tax Credit Annual Energy Outlook 2007
Average Annual Growth Rates of Real GDP, Labor Force, and Productivity in Three Cases, 2005-2030 percent per year Low Growth Reference High Growth Annual Energy Outlook 2007
Average Annual Inflation, Interest, and Unemployment Rates in Three Cases, 2005-2030 percent per year Low Growth Reference High Growth Annual Energy Outlook 2007
Sectoral Composition of Industrial Output Growth Rates in Three Cases, 2005-2030 Low Growth Reference High Growth percent per year Annual Energy Outlook 2007
Energy Expenditures in the U.S. Economy,1990-2030 billion 2005 dollars High Growth Reference Low Growth History Projections Annual Energy Outlook 2007
Energy Expenditures as a Share of Gross Domestic Product, 1970-2030 nominal expenditures as a percent of nominal GDP Energy Intensity (thousand Btu per real dollar of GDP) 17.4 9.1 5.8 All Energy Petroleum Natural Gas History Projections Annual Energy Outlook 2007
World Oil Prices in Three Cases, 1980-2030 2005 dollars per barrel High Price Reference Low Price History Projections Annual Energy Outlook 2007
U.S. Gross Petroleum Imports by Source, 2005-2030 million barrels per day Other Far East Caribbean Europe North America Other OPEC OPEC Persian Gulf Annual Energy Outlook 2007
Unconventional Resources as a Share of the World Liquids Market, 1990-2030 percent History Projections High Price Reference Low Price Annual Energy Outlook 2007
World Liquids Production Shares by Region,2005 and 2030 percent Africa/ Middle East Far East Central/South America Europe and Eurasia North America Other OPEC OPEC Persian Gulf 2030 Annual Energy Outlook 2007
Energy Use per Capita and per Dollar of Gross Domestic Product, 1980-2030 index, 1980=1 Energy use per capita Energy use per dollar GDP History Projections Annual Energy Outlook 2007
Primary Energy Use by Fuel, 2005-2030 quadrillion Btu Other Renewables Hydropower Nuclear Coal Natural Gas Petroleum Annual Energy Outlook 2007
Delivered Energy Use by Fuel, 1980-2030 quadrillion Btu History Projections Liquid Fuels Natural Gas Electricity Coal Renewables Annual Energy Outlook 2007
Primary Energy Consumption by Sector, 1980-2030 quadrillion Btu Residential Commercial Industrial Transportation Annual Energy Outlook 2007
Residential Delivered Energy Consumption per Capita, 1990-2030 index, 1990=1 2006 Technology Reference High Technology History Projections Annual Energy Outlook 2007
Residential Delivered Energy Consumption by Fuel,2005, 2015, and 2030 quadrillion Btu 2005 2015 2030 Annual Energy Outlook 2007
Efficiency Indicators for Selected Residential Appliances, 2005 and 2030 index, 2005 stock efficiency=1 2030 Stock, Best Available Technology Case 2030 Stock, 2006 Technology Case 2005 Stock Annual Energy Outlook 2007
Commercial Delivered Energy Consumption per Capita, 1980-2030 index, 1980=1 2006 Technology High Technology Reference History Projections Annual Energy Outlook 2007
Commercial Delivered Energy Consumption by Fuel,2005, 2015, and 2030 quadrillion Btu 2005 2015 2030 Annual Energy Outlook 2007
Efficiency Indicators for Selected Commercial Energy End Users, 2005 and 2030 index, 2005 stock efficiency=1 2030 Stock, Best Available Technology Case 2030 Stock, 2006 Technology Case 2005 Stock Annual Energy Outlook 2007
Buildings Sector Electricity Generation from Advanced Technologies, 2030 percent change from reference case High Technology Best Available Technology Annual Energy Outlook 2007
Industrial Delivered Energy Consumption, 1980-2030 quadrillion Btu High Growth Reference Low Growth History Projections Annual Energy Outlook 2007
Average Output Growth in the Manufacturing Subsectors, 2005-2030 Reference High Growth Low Growth Annual Energy Outlook 2007
Average Growth of Delivered Energy Consumption in the Manufacturing Subsectors, 2005-2030 Low Growth High Growth Reference Annual Energy Outlook 2007
Industrial Delivered Energy Intensity, 1980-2030 thousand Btu per 2000 dollar value of shipments History Projections Reference 2006 Technology High Technology Annual Energy Outlook 2007
Average Change in Energy Intensity in the Manufacturing Subsectors, 2005-2030 2006 Technology Reference High Technology Annual Energy Outlook 2007
Delivered Energy Consumption for Transportation,1980-2030 quadrillion Btu High Growth Low Price Reference High Price Low Growth History Projections Annual Energy Outlook 2007
Delivered Energy Consumption in Light-Duty Vehicles, 1980-2030 quadrillion Btu High Growth Reference Low Price High Price Low Growth History Projections Annual Energy Outlook 2007