Download
1 / 20
200 likes | 700 Vues
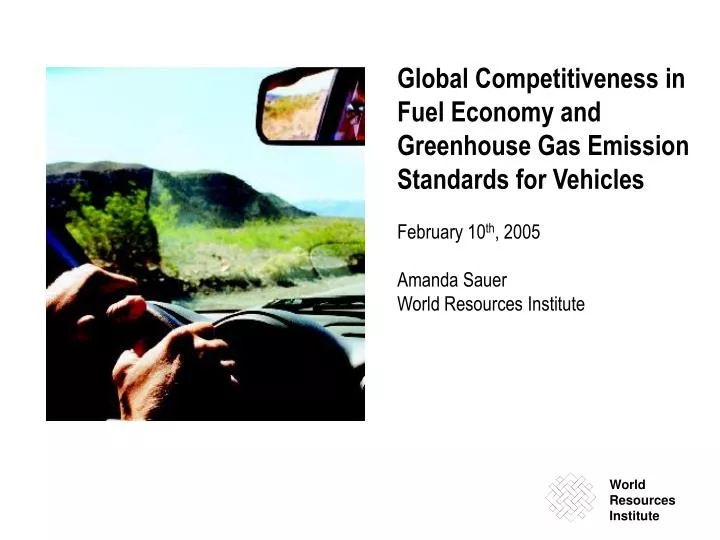
Global Competitiveness in Fuel Economy and Greenhouse Gas Emission Standards for Vehicles February 10 th , 2005 Amanda Sauer World Resources Institute. World Resources Institute. Overview of Presentation. Climate change and automobiles

E N D
Global Competitiveness in Fuel Economy and Greenhouse Gas Emission Standards for VehiclesFebruary 10th, 2005Amanda SauerWorld Resources Institute World Resources Institute
Overview of Presentation • Climate change and automobiles • Comparison of fuel economy and GHG emissions regulations around the world • Impacts of these regulations on competitiveness and value creation in the auto industry
3 Climate Change and Automobiles • Auto industry in policymakers’ crosshairs because of CO2 emissions released from burning of fuel: • Transport accounts for 30% of OECD CO2 emissions • Cars and light trucks account for 20% of U.S. emissions. • Industry is part of the problem… • Light trucks, “SUV phenomenon” • Disregard for fuel economy • …but also part of the solution: • New hybrid and diesel technologies, and ultimately fuel cells
Climate Change and Automobiles • Pressure to reduce vehicle CO2 emissions • Direct vehicle use emissions make up 75% of CO2 releases • Related fuel production emissions make up a further 14% • EU, Japan, California, Canada all focused on vehicle use emissions Materials Assembly Fuel production Vehicle Use
5 Fuel Economy and GHG Emissions Regulations in the World’s Major Auto Markets • European Union: “ACEA agreement” seeks 25% reduction in vehicle CO2 emissions levels by 2008 (from 1995 levels). Agreement may be extended an additional 10% by 2012. • Japan: requires 23% reduction in vehicle CO2 emissions by 2010 (from 1995 levels). • Australia: voluntary commitment to improve fuel economy by 18% by 2010. • Canada: has proposed a 25% improvement in fuel economy by 2010. • China: Introduced new fuel economy standards in 2004; weight-based standards to be introduced in 2 phases (2005 and 2008). • California: CARB approved GHG emissions reductions for automobiles, currently under legislative review. • New York: Clean Cars Bill proposing to follow California standards is currently in committee. Several other NE states have indicated they will follow CA’s lead. An and Sauer, 2004 for the Pew Center on Global Climate Change
Overview of Vehicle Fuel Efficiency and GHG Standards Around the World An and Sauer, 2004 for the Pew Center on Global Climate Change
Issues of Comparing Vehicle Standards around the World • Differences in test driving cycles • Fuel economy vs. fuel consumption vs. CO2 emissions • Regulatory vs. voluntary • Differences in vehicle categories and weight-classes • Corporate fleet averages vs. minimum requirements An and Sauer, 2004 for the Pew Center on Global Climate Change
Conversion factors to CAFE-equivalent MPG and EU-equivalent CO2 emission rate of g/km An and Sauer, 2004 for the Pew Center on Global Climate Change
Methodology to Compare Fuel Economy Standards Worldwide 1. Research country/region-specific fuel economy/GHG standards and future targets 2. Convert fuel economy/GHG standards into fleet averages (assume that fleet composition remains constant for weight/size or vehicle type targets and that all voluntary targets will be met) 3. Choose reference standards (in this example, US CAFE) 4. Apply conversion factors (from table on preceding slide) 5. Countries/regions now converted to reference standards and are comparable An and Sauer, 2004 for the Pew Center on Global Climate Change
Comparison of Fuel Economy and GHG Emission Standards An and Sauer, 2004 for the Pew Center on Global Climate Change
Lower-carbon Technology Options • Carbon constraints will force OEMs to add new technologies, some of which may lead to competitive gains • Key technologies: • Incremental Technologies (fuel injection, continuously variable transmission etc.) • Diesel Technology (compression-ignition) • Hybrid Technology • Fuel Cell Technology
6 Carbon Reduction PotentialKey engine technologies that provide mid- to long-term reductions of vehicle carbon emissions
7 Carbon-intensity of SalesDependency of 2002 sales in US, EU and Japan on vehicles of high-, medium- and low-carbon intensity High: worse than 20.7 on-road mpg; Low: better than 27.5 on-road mpg; Medium: between 20.7 and 27.5 on-road mpg
8 Aggregate Value ExposureEstimated cost per vehicle to meet “most likely” carbon constraint scenarios in US, EU and Japan 25x difference in Value Exposure across the industry
9 Management Capacity for Low-Carbon TechnologiesMeasure of OEMs’ capacity to develop and commercialize main low-carbon technologies: hybrids, diesels & fuel cells
10 Carbon Positioning of Leading OEMsSuccess in a carbon-constrained market will require moving into the top-right quadrant Honda Renault PSA Nissan Toyota VW Decreasing Carbon Risks (estimated cost per vehicle to meet new carbon constraints) GM Ford DaimlerChrysler BMW Increasing Carbon Opportunities (management capacity score on low-carbon technologies)
11 Implications of Carbon Constraints for Future EarningsEstimated changes in forecast earnings from inclusion of carbon constraint factors; ranges reflect alternative regulatory scenarios in US, EU and Japan.
16 Conclusions • The European Union (EU) and Japan have the most stringent standards in the world. • The fuel economy and greenhouse gas emission performance of the U.S. automobile fleet -- both historically and projected based on current policies -- lag behind most other nations. • These GHG and fuel economy regulations create financial risks and opportunities for automobile companies. • In our analysis, we found the financial implications of these regulations to range from +10% to -14% of operating income. • Overall, the automobile industry is becoming increasingly global in scope with these regulations are becoming increasingly stringent (with the exception on the U.S.). Therefore fuel economy will become a major driver in the financial performance of automobile companies.
Amanda Sauer Associate 202 729 7689 amanda@wri.org Changing Drivers report available at: http://capitalmarkets.wri.org Comparison of Fuel Economy and GHG Emissions Standards report available at: http://www.pewclimate.org 17 Contact Information