Download
1 / 30
300 likes | 420 Vues
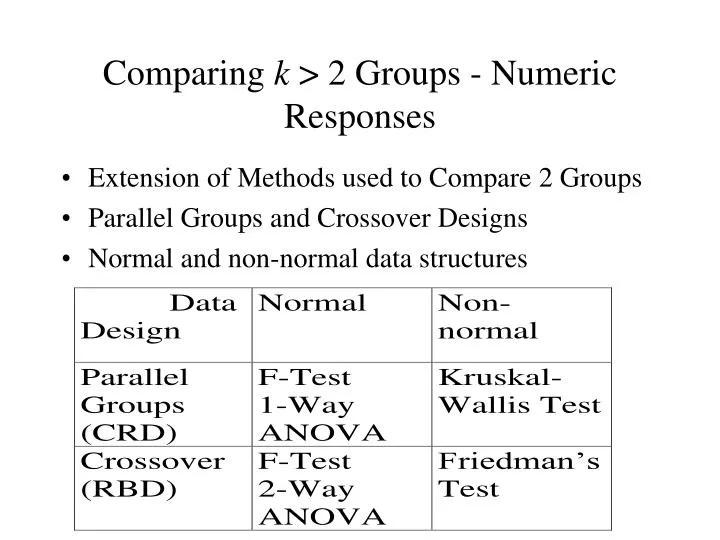
Comparing k > 2 Groups - Numeric Responses. Extension of Methods used to Compare 2 Groups Parallel Groups and Crossover Designs Normal and non-normal data structures. Parallel Groups - Completely Randomized Design (CRD).

E N D
Comparing k > 2 Groups - Numeric Responses • Extension of Methods used to Compare 2 Groups • Parallel Groups and Crossover Designs • Normal and non-normal data structures
Parallel Groups - Completely Randomized Design (CRD) • Controlled Experiments - Subjects assigned at random to one of the k treatments to be compared • Observational Studies - Subjects are sampled from k existing groups • Statistical model Yij is a subject from group i: where mis the overall mean, ai is the effect of treatment i , eij is a random error, and mi is the population mean for group i
1-Way ANOVA for Normal Data (CRD) • For each group obtain the mean, standard deviation, and sample size: • Obtain the overall mean and sample size
Analysis of Variance - Sums of Squares • Total Variation • Between Group Variation • Within Group Variation
Analysis of Variance Table and F-Test • H0: No differences among Group Means (a1==ak=0) • HA: Group means are not all equal (Not all ai are 0)
Example - Relaxation Music in Patient-Controlled Sedation in Colonoscopy • Three Conditions (Treatments): • Music and Self-sedation (i = 1) • Self-Sedation Only (i = 2) • Music alone (i = 3) • Outcomes • Patient satisfaction score (all 3 conditions) • Amount of self-controlled dose (conditions 1 and 2) Source: Lee, et al (2002)
Example - Relaxation Music in Patient-Controlled Sedation in Colonoscopy • Summary Statistics and Sums of Squares Calculations:
Example - Relaxation Music in Patient-Controlled Sedation in Colonoscopy • Analysis of Variance and F-Test for Treatment effects • H0: No differences among Group Means (a1==a3=0) • HA: Group means are not all equal (Not all ai are 0)
Post-hoc Comparisons of Treatments • If differences in group means are determined from the F-test, researchers want to compare pairs of groups. Three popular methods include: • Dunnett’s Method - Compare active treatments with a control group. Consists of k-1 comparisons, and utilizes a special table. • Bonferroni’s Method - Adjusts individual comparison error rates so that all conclusions will be correct at desired confidence/significance level. Any number of comparisons can be made. • Tukey’s Method - Specifically compares all k(k-1)/2 pairs of groups. Utilizes a special table.
Bonferroni’s Method (Most General) • Wish to make C comparisons of pairs of groups with simultaneous confidence intervals or 2-sided tests • Want the overall confidence level for all intervals to be “correct” to be 95% or the overall type I error rate for all tests to be 0.05 • For confidence intervals, construct (1-(0.05/C))100% CIs for the difference in each pair of group means (wider than 95% CIs) • Conduct each test at a=0.05/C significance level (rejection region cut-offs more extreme than when a=0.05)
Bonferroni’s Method (Most General) • Simultaneous CI’s for pairs of group means: • If entire interval is positive, conclude mi > mj • If entire interval is negative, conclude mi < mj • If interval contains 0, cannot conclude mi mj
Example - Relaxation Music in Patient-Controlled Sedation in Colonoscopy • C=3 comparisons: 1 vs 2, 1 vs 3, 2 vs 3. Want all intervals to contain true difference with 95% confidence • Will construct (1-(0.05/3))100% = 98.33% CIs for differences among pairs of group means Note all intervals contain 0, but first is very close to 0 at lower end
CRD with Non-Normal Data Kruskal-Wallis Test • Extension of Wilcoxon Rank-Sum Test to k>2 Groups • Procedure: • Rank the observations across groups from smallest (1) to largest (n = n1+...+nk), adjusting for ties • Compute the rank sums for each group: T1,...,Tk . Note that T1+...+Tk = n(n+1)/2
Kruskal-Wallis Test • H0: The k population distributions are identical (m1=...=mk) • HA: Not all k distributions are identical (Not all mi are equal) Post-hoc comparisons of pairs of groups can be made by pairwise application of rank-sum test with Bonferroni adjustment
Example - Thalidomide for Weight Gain in HIV-1+ Patients with and without TB • k=4 Groups, n1=n2=n3=n4=8 patients per group (n=32) • Group 1: TB+ patients assigned Thalidomide • Group 2: TB- patients assigned Thalidomide • Group 3: TB+ patients assigned Placebo • Group 4: TB- patients assigned Placebo • Response - 21 day weight gains (kg) -- Negative values are weight losses Source: Klausner, et al (1996)
Example - Thalidomide for Weight Gain in HIV-1+ Patients with and without TB
Weight Gain Example - SPSS OutputF-Test and Post-Hoc Comparisons
Weight Gain Example - SPSS OutputF-Test and Post-Hoc Comparisons
Crossover Designs: Randomized Block Design (RBD) • k > 2 Treatments (groups) to be compared • b individuals receive each treatment (preferably in random order). Subjects are called Blocks. • Outcome when Treatment i is assigned to Subject j is labeled Yij • Effect of Trt i is labeled ai • Effect of Subject j is labeled bj • Random error term is labeled eij
Crossover Designs - RBD • Model: • Test for differences among treatment effects: • H0: a1 = ... = ak= 0 (m1= ... = mk ) • HA: Not all ai = 0 (Not all mi are equal)
RBD - ANOVA F-Test (Normal Data) • Data Structure: (k Treatments, b Subjects) • Mean for Treatment i: • Mean for Subject (Block) j: • Overall Mean: • Overall sample size: n = bk • ANOVA:Treatment, Block, and Error Sums of Squares
RBD - ANOVA F-Test (Normal Data) • ANOVA Table: • H0: a1 = ... = ak= 0 (m1= ... = mk ) • HA: Not all ai = 0 (Not all mi are equal)
Example - Theophylline Interaction • Goal: Determine whether Cimetidine or Famotidine interact with Theophylline • 3 Treatments: Theo/Cim, Theo/Fam, Theo/Placebo • 14 Blocks: Each subject received each treatment • Response: Theophylline clearance (liters/hour) Source: Bachmann, et al (1995)
Example - Theophylline Interaction • The test for differences in mean theophylline clearance is given in the third line of the table • T.S.: Fobs=10.59 • R.R.:Fobs F.05,2,26 = 3.37 (From F-table) • P-value: .000 (Sig. Level)
Example - Theophylline InteractionPlot of Data (Marginal means are raw data)
RBD -- Non-Normal DataFriedman’s Test • When data are non-normal, test is based on ranks • Procedure to obtain test statistic: • Rank the k treatments within each block (1=smallest, k=largest) adjusting for ties • Compute rank sums for treatments (Ti) across blocks • H0: The k populations are identical (m1=...=mk) • HA: Differences exist among the k group means
Example - tmaxfor 3 formulation/fasting states • k=3 Treatments of Valproate: Capsule/Fasting (i=1), Capsule/nonfasting (i=2), Enteric-Coated/fasting (i=3) • b=11 subjects • Response - Time to maximum concentration (tmax) Source: Carrigan, et al (1990)
Example - tmaxfor 3 formulation/fasting states • H0: The k populations are identical (m1=...=mk) • HA: Differences exist among the k group means