Download
1 / 52
520 likes | 706 Vues
HISP. Aims of this lecture See the big picture of HISP, all that surrounds the software Introduction to DHIS. Overview of lecture. HISP overview Goals Activities Information systems in the context of developing countries How data is collected and transformed into information

E N D
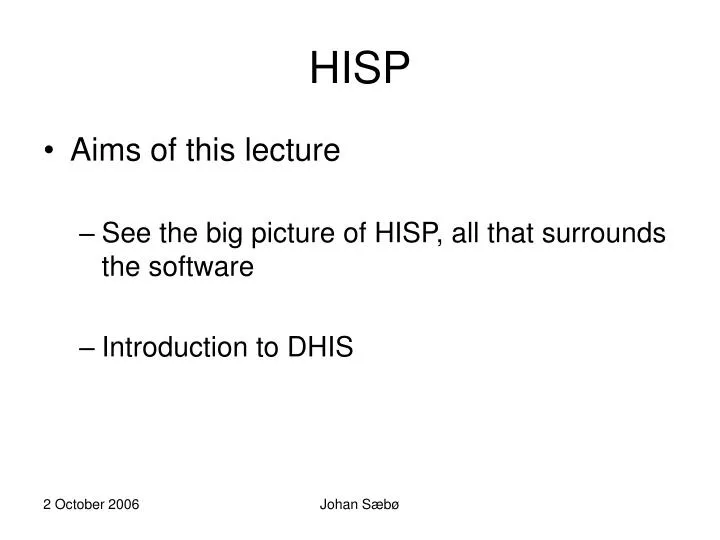
HISP • Aims of this lecture • See the big picture of HISP, all that surrounds the software • Introduction to DHIS Johan Sæbø
Overview of lecture • HISP overview • Goals • Activities • Information systems in the context of developing countries • How data is collected and transformed into information • Use of information • DHIS and the key design principles Johan Sæbø
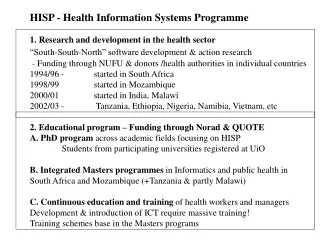
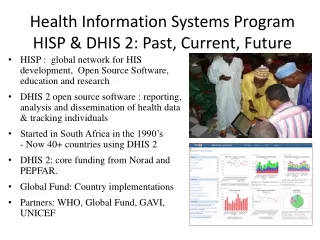
What is HISP? • Health Information Systems Programme • Global network of individuals and organisations • Academic institutions • Non-governmental organisations • Governmental organisations • Members are orientated towards the “HISP goal” • An example of a South-South-North collaboration Johan Sæbø
The HISP goal • To support local management of health care delivery and information flows • Design, implement and sustain HIS following a participatory approach • In health facilities, districts, and provinces • And its further spread within and across developing countries Johan Sæbø
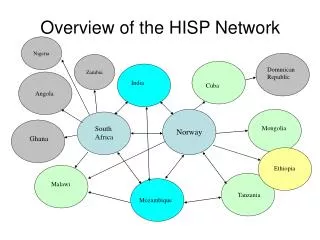
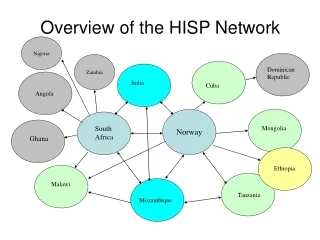
HISP is truly global Johan Sæbø
Achieved through • HIS design, development and implementation (including, but not limited to software) • Organisational and human resources development • Theoretical and practical knowledge about challenges of implementing HIS in developing countries (action research) Johan Sæbø
Short history • Started in South Africa after Apartheid • Software piloted in one province for two years • Political climate allowed a total renovation of the health system • Strategy followed a bottom-up development and standardization Johan Sæbø
Short history • Mozambique first international node • India, Malawi, Cuba, Ethiopia, Tanzania, Vietnam, Botswana, Nigeria, Mongolia etc. • Considerable human capacity on HISP developed in India, Ethiopia, Mozambique • Different contexts call for different approaches Johan Sæbø
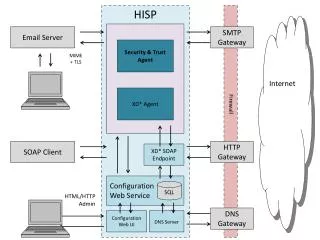
HISP as a FOSS project • Software (District Health Information Software, DHIS), FOSS • Emphasis on • Participatory development • Creation of software that empowers the users • Increasingly open to use of and integration with other FOSS packages • Distributed development although major work done in South Africa • Customisation of packages done locally • Multilanguage enabled software Johan Sæbø
Critique of Software development (last year’s slide) • Too focused on SA • In fact too focused on a single individual in SA • Possibly we have not harnessed opportunities in India strongly enough • In some countries software development component has not been complemented with a strong enough “project implementation” focus Johan Sæbø
Software development today • South Africa • Main engine of development of v1.3 and 1.4 • Oslo • Two PhD’s and numerous Master’s students developing v.2.0 • India • Many programmers, working with 1.4 and 2.0 • Vietnam • Some programmers, working with 2.0 • Various other smaller projects • Extra modules often made locally Johan Sæbø
The context of a developing country • Often severe problems related to: • Infrastructures • Human resources • Inequality (urban/rural) • Hardware and spare parts • Politics • Migration, natural disasters, war etcs • Centralistic, bloated, and fragmented legacy systems Johan Sæbø
Health Information use in developing countries • Curative vs. Preventive approach reflected in information system • Little use of information at local levels • Little use of indicators, focus on raw data • Centralistic approach, data collected for the top level, little or no feedback • Fragmented, little communication between health managers Johan Sæbø
Legacy systems • Hard to change, reflects power relationships • Donor agencies works around them by making their own systems, just increasing the original problem of fragmentation. • Developer has left many years ago, took the code with him • Legacy systems can be a force of resistance against new systems Johan Sæbø
HISP strategy • Often beginning with a strong association with grass roots organisations and services • Focus on piloting and modifying system in a few districts • Empower local health managers with information and train them how to use it • Creation of alliances with ministry for recognition of grass-roots progress and further roll-out Johan Sæbø
Current Scenario, Botswana IDSR – Notifiable EPI Home Based Care Diseases Health Statistics PMTCT STD Nutrition Family Planning MCH HIV/AIDS School Health TB Mental Health And more … District - DHT ARV IPMS Facility 1 Facility 2 Facility 3 Facility n Johan Sæbø
IDSR – Notifiable MASA Home Based Care EPI Diseases IPMS Health Statistics PMTCT Nutrition Family Planning STD MCH IPT School Health TB National HIS Mental Health Others District 1 DHIS District 2 DHIS District n DHIS Facility 1 Facility 2 Facility 3 Facility n Future scenario, Botswana Johan Sæbø
Part IIDHIS and design principles Johan Sæbø
Basic Criteria for Health Information Software:1. Data capture: • Prevents the capture of duplicate datasets. • Has mechanisms for data validation. • Can be adapted by users to reflect the changing reality in the health sector • Organisational units • Data elements (and indicators). • Is able to calculate indicators that use population as a denominator. Johan Sæbø
2. Reporting functions: • Reporting must be readily available to provide managers with real time data. • Can provide automatic reports to various organisational levels. • Must allow the creation of customised reports • Links to GIS functionality Johan Sæbø
Immunisation Coverage 2001 Immunisation Coverage 2002 Johan Sæbø
3. Export/Import function: • Can automatically export data from lower levels for import at higher levels. • Can specify data export of different groups of data (for onward transmission to various stakeholders – e.g. donors, programme managers, etc). • Can export data for use with other applications and databases Johan Sæbø
4. Maintenance: • Can be locally (in country) supported, adapted, and developed. • FOSS + Platform independent Johan Sæbø
HISP activities are all about moving people from providing services, to also using information to manage services Johan Sæbø
Record of patients seen Summary of key information Data analysis and use Data entry into database Johan Sæbø
DHIS • Originally developed in Visual Basic for MS Access and Excel • DHIS 1.4 last version to be tied to MS • DHIS 2.0 platform independent FLOSS, web-enabled. Same functions as 1.4 • 1.4 still used in most countries, some use of 2.0 in India and Ethiopia Johan Sæbø
DHIS, the basic structure • Same principle for all versions of DHIS • Need to reflect the health hierarchy • Need to map data to each reporting unit • Need to be easy to use • Need to be flexible Johan Sæbø
The Organisational Hierarchy DHIS 1.4 supports an “infinite” number of OrgUnit levels in the hierarchy, but standard setups would be between 3 and 7. The lowest level is in this case called the “reporting OrgUnit”. “Reporting OrgUnit” Johan Sæbø
The Organisational Hierarchy “Parent OrgUnit” Country Health district Facility “Parent OrgUnit” Reporting OrgUnits belong to parent OrgUnits, which are either physical health facilities (clinics, hospitals) or administrative OrgUnits arranged in a hierarchical structure. Parent OrgUnits can also be reporting OrgUnits, but the norm is to collect as much data as possible at the lowest level. “Reporting OrgUnit” Johan Sæbø
An example of an organisational hierarchy in the DHIS14 1. Central Ministry 2. Health districts 3. Health facilities Johan Sæbø
Adding data to the org units “Parent OrgUnits” Data that is collected is “attached” or “linked” to reporting units. “Parent OrgUnits” “Reporting OrgUnit” “Semi-permanent data” • Routine data set (monthly, weekly, quarterly, annually, daily, etc) • Data element 1 • Data element 2 • Data element n Johan Sæbø
Adding data to the org units “Parent OrgUnit” Data can also be added to higher level OrgUnits (i.e. data can be captured at multiple levels) “Parent OrgUnit” “Reporting OrgUnit” “Semi-permanent data” • Routine data set • Data element 1 • Data element 2 • Data element n Johan Sæbø
Understanding org units, org unit groups, and org unit group sets Org unit 1 Group 1 Group set 1 Org unit 2 Group 2 Org unit 3 Group 3a Exclusive Org unit 4 Group 3b Group set 2 Compulsory Org unit 5 • An example: • Org unit types • Location • Ownership Org unit 6 Group 3c Johan Sæbø
Understanding org units, org unit groups, and org unit group sets Exclusive Org unit 1 Group 1 Group set 1 Compulsory Org unit 2 Group 2 • Examples: • Accreditation • Inclusion in Training programmes • Inclusion in research projects Org unit 3 Group 3a Org unit 4 Group 3b Group set 2 Org unit 5 Org unit 6 Group 3c Johan Sæbø
Importance of this function • Health services are often in a state of flux • Hard-coding various types of classification (e.g. groupings might thus block specific use • Enabling the user to determine these options increases functionality in an environment that is constantly changing (and with large variations between DHIS-using countries) • Main purpose of these groupings is to allow analysis to be performed on certain groups • Limits on groupings in version 1.3 have been a significant impediment, with a lot of tinkering and ad-hoc modifications necessary to make it work Johan Sæbø
Understanding data elements, and data element groups (which are also used as indicator groups) • Routine data set • Data element 1 • Data element 2 • Data element n Data element groups Indicators Johan Sæbø
Understanding the data elements, and data element groups • Routine/semi-permanent/survey data sets: • Data element 1 • Data element 2 • Data element n Raw data Data element groups Processed information Indicators Johan Sæbø
Understanding data elements, and data element groups Data element Data element Data element Data element Data element Data element Data element Data element Data element Data element Data element Data element Data element Data element Data element Data Element & Indicator Groups are defined in the lookup tables. The grouped data elements / indicators have some characteristic in common (a data entry form, a programme/service, whether they are gender sensitive or not) Data element Data element Data element People are interested in a grouping in one way or another – this is what we analyse Johan Sæbø
Understanding data elements, and data sets Data element 1 Data set 1 Data element 2 Data element 3 Data element 4 Data element 5 Data element 6 Data set 2 Each data set can be used to capture or import data for a number of OrgUnits – but it may not be necessary for all org units to complete all data sets. Typically, a data set reflect either one paper form, a collection of data that “belong together” (e.g. Census data), or a collection of data elements traditionally updated in a similar manner (e.g. semi-permanent data) The DHIS “back-end” data file uses One table to store all data elements. Each data element can be assigned to one or more data sets. Johan Sæbø
Understanding data elements, and data sets Data element 1 Data set 1 Data entry form 1 Data element 2 Data element 3 Data element 4 Data element 5 Data element 6 Data set 2 Data entry form 3 • A data entry form can be created to address the specific needs of: • A dataset, or • An org unit. Johan Sæbø