Download
1 / 35
350 likes | 547 Vues
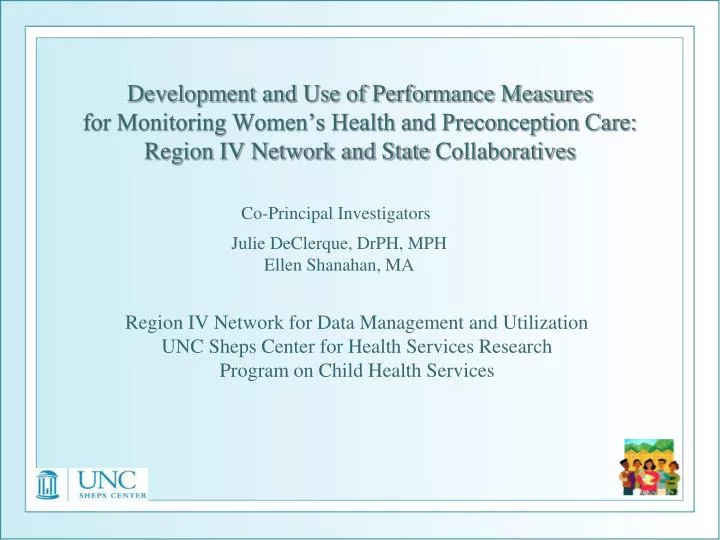
Development and Use of Performance Measures for Monitoring Women’s Health and Preconception Care: Region IV Network and State Collaboratives. Co-Principal Investigators. Julie DeClerque, DrPH, MPH Ellen Shanahan, MA. Region IV Network for Data Management and Utilization

E N D
Development and Use of Performance Measures for Monitoring Women’s Health and Preconception Care: Region IV Network and State Collaboratives Co-Principal Investigators Julie DeClerque, DrPH, MPHEllen Shanahan, MA Region IV Network for Data Management and Utilization UNC Sheps Center for Health Services Research Program on Child Health Services
Initial Focus on Infant MortalityUS DHHS Health Care Region IV Had Highest Rates RNDMU Began 1983: Track Indicators to Monitor Trends • Initial SPRANS grant 1983 focused on tracking infant mortality • Focus shifted in 1990, funding through Title X • Added FP indicators, with another wave in 1997 (11 women’s health) • FP considered first step in preventing high-risk pregnancies • FP service indicators given high priority as basic IM reduction strategy • Workshops 2009-2010: focus on women’s health and preconception care
RNDMU Data Network Features • State collaborative across 8 states of Region IV • Title X grantees in each state (10 in all) • Longitudinal State and Regional data • Over 125 perinatal indicators • Data sources: • State vital records, including abortion • Medicaid deliveries • Family planning administrative reports (FPAR) • BRFSS / PRAMS • Communicable Disease / Immunization Surveillance • Guttmacher “in-need” estimates • Annual Databookproduced by Sheps Center • All tables available on Website in Excel format • http://www.shepscenter.unc.edu/data/RNDMU/LongitudinalExcelTables/DataTablesExcel.html
Revised Concept Map and Databook Organization • Five Domains (Total Indicators: 121) • Personal Health and Lifestyle (28) • Family Planning (37) • Fertility (13) • Pregnancy (18) • Pregnancy Outcomes (25)
Highlights from RNDMU Domains I and II • Trends over time • Indicators of unmet need • Example issues, reports, collaboratives
Post-partum and Family Planning Visits Opportunities for Addressing Chronic Conditions • Healthy Weight • Diabetes • Hypertension • Asthma Opportunities for PromotingEffective Birth Spacing • Understanding BC methods • Side effects • Availability of EC • Risks and consequences of infection
Overweight and Obesity among Women in Region IV 1998 - 2008 BRFSS Data for Women Age 18-44
Risk Behaviors in Region IV: Unhealthy Weight BRFSS Data for Women 18-44: 1998 - 2008 • Overweight • Total: 23% to 28% + 22% • Blacks: 30% to 36% + 20% • Whites: 21% to 25% + 19% • Obese • Total: 19% to 26% + 37% • Blacks: 29% to 41% + 41% • Whites: 15% to 23% + 35%
Adequate Physical Activity, Region IV BRFSS Data for Women 18 – 44. Note: odd numbered years only
Protective Behaviors in Region IV • Adequate Physical Activity (change 2001- 2007) • Total: 44% to 47% • Blacks: 36% to 40% • Whites: 47% to 49% • Five + Daily Fruits and Vegetables (1998–2008) • Total: 22% to 25% • Blacks: 15% to 25% -- a notable change • Whites: 24% to 24% BRFSS Data for Women 18-44: 2001 – 2007 for physical activity; 1998 - 2008 for fruit and vegetable consumption
Chronic Conditions in Region IV BRFSS Data for Women 18-44: 1998 – 2008 • Diabetes including Gestational Diabetes • Total: 4.4% to 6.7% • Blacks: 4.6% to 9.0% • Whites: 4.5% to 5.9% • Almost no racial disparity in 1998 • 1.5 times greater risk for Black women in 2008
Chronic Conditions in Region IV BRFSS Data for Women 18-44: 1999 – 2007, odd-numbered years only • Hypertension including Gestational Hypertension • Total: 12.3% to 13.7% • Blacks: 19.8% to 22.5% • Whites: 10.6% to 11.8% • 1999: Racial disparity almost double • 2007: Almost no change in disparity
Chronic Conditions in Region IV • Current Diagnosis of Asthma • Total: 7.8% to 9.8% • Blacks: 10.7% to 11.3% • Whites: 7.2% to 9.8% -- one third higher over time • 2000: Risk 1.5 times greater for Blacks • By 2008: Racial disparity decreased from 50% to 15% • Mostly due to worsening of White rates BRFSS Data for Women 18-44: 2000-2008
Region IV Title X Users In-Need and Not Served by Title X 2000-2006
Indicator of Unmet Need: Declining Rates of Healthy (2-5 yr) SpacingOptimal Birth Interval Rates in Region IV1998-2008
Indicator of Unmet Need: Rapid Repeat PregnancyPercent of Live Births (+Fetal Deaths) that were Repeat PregnanciesRegion IV 1998 - 2008 by Age
Indicator of Unmet Need:Women Not Trying to Become Pregnant (but) Using No ContraceptionPRAMS 1998-2008
Women With a Live Births Using a Contraceptive Method at the Time of Pregnancy Region IV: 1998 – 2008, PRAMS Indicator of Unmet Need: Contraceptive Method Failure
Consistency of Contraceptive Method Use During the Month before Conception, US 2001 Gold RB, Sonfield A, Richards CL, Frost JJ. Next Steps for America’s Family Planning Program: Leveraging the Potential of Medicaid and Title X in an Evolving Health Care System. New York: Guttmacher Institute, 2009
Female Title X Users by Contraceptive Method Mix Region IV 2005 - 2009 Rates exclude women who were using no method, or who were pregnant, or seeking pregnancy
Indicator of Unmet Need:High % of Teen Pregnancies Ending in Abortion (Age <18)
Indicator of Unmet Need:High % of Adult Pregnancies Also Ending in Abortion (Age 18 and over)
How Does Region IV Compare with US Total?Induced Abortion Rate (Age 15-44) per 1,000
Reproductive Tract Infections in Region IV Combined Syphilis, Gonorrhea and ChlamydiaFemales (Age 15+) Rate per 100,000 Source: Title X FPAR
Female Title X Users Obtaining a Pap TestRegion IV 2005 - 2009
Substance Use in Region IV BRFSS Data for Women 18-44: 1998 - 2008 • Change in Smoking Rates (10 years) • Total: 27.4% to 21.7% (21% decrease) • Blacks: 16.2% to 11.6% (28% decrease) • Whites: 30.9 to 26.2% (15% decrease)
Substance Use in Region IV BRFSS Data for Women 18-44 2001 – 2008 for heavy drinking; 1999 - 2008 for binge drinking • Heavy Drinking (Change 2001- 2008) • Total: 4.5% to 3.9% • Blacks: 2.6% to 2.7% • Whites: 5.1 to 4.2% • Binge Drinking (Change 1999-2008) • Total: 7.9% to 11.7% • Blacks: 5.0% to 7.0% • Whites: 8.8% to 13.4%
Family Planning Clinics As Medical Home • “More than six in 10 women who obtain care at a FP center consider it as their usual source of medical care.” • “The package of basic, preventive sexual and reproductive health services routinely provided in family planning centers—along with contraceptive services and supplies—is essentially the same package of care a private physician offers a woman during her annual gynecologic exam.” Gold RB, Sonfield A, Richards CL, Frost JJ. Next Steps for America’s Family Planning Program: Leveraging the Potential of Medicaid and Title X in an Evolving Health Care System. New York: Guttmacher Institute, 2009
Change in Access to Care in Region IV1998 - 2008 • Have Current Health Coverage • Total: 80% to 80% • Blacks: 73% to 76% • Whites: 81% to 82% • Could Not See Physician Due to Cost • Total: 19% to 24% • Blacks: 21% to 26% • Whites: 18% to 22% BRFSS Data for Women 18-44, 1998 - 2008
RNDMU: Resource for Multiple Issues Infant mortality and correlated risk factors High-risk childbearing Family Planning: Users, Need Met, Indicators of Unmet Need Latina Health: Many indicators now tracked by Hispanic ethnicity FP Medicaid Waiver Evaluators: cost-savings due to averted births Women’s Health and Preconception/Wellness Care Other: Refining Pregnancy Intention Measures Surveillance of FP clients presenting for PT or EC
Questions? For more information about RNDMU contact: Julie_DeClerque@unc.edu(919) 966-7106 Ellen_Shanahan@unc.edu(919) 966-8445 Please visit us at our website http://www.shepscenter.unc.edu/data/RNDMU/index.html Thank you!