Download
1 / 50
500 likes | 632 Vues
Cluster analysis Chong Ho Yu. Why do we look at grouping (cluster) patterns?. This regression model yields 21% variance explained. The p value is not significant (p=0.0598) But remember we must look at (visualize) the data pattern rather than reporting the numbers. These are the data!.

E N D
Why do we look at grouping (cluster) patterns? • This regression model yields 21% variance explained. • The p value is not significant (p=0.0598) • But remember we must look at (visualize) the data pattern rather than reporting the numbers
Netflix original • How is “House of cards” related to cluster analysis?
Crime hot spots How can criminologists find the hot spots?
Data reduction • Group variables into factors or components based on people’s response patterns • PCA • Factor analysis • Group people into groups or clusters based on variable patterns • Cluster analysis
CA: ANOVA in reverse • In ANOVA participants are assigned into known groups. • In cluster analysis groups are created based on the attitudinal or behavioral patterns with reference to certain independent variables.
Discriminant analysis (DA) • There is a test procedure that is similar to cluster analysis: Discriminant analysis (DA) • But in DA both the number of groups (clusters) and their content are known. Based on the known information (examples), you assign the new or unknown observations into the existing groups.
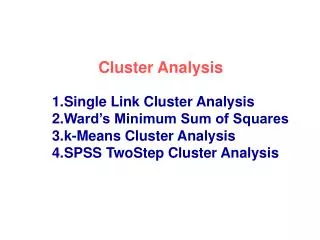
Cluster analysis • Types: • K-mean clustering (SAS, JMP, SPSS) • Density-based clustering (SAS) • Hierarchical clustering (SAS, JMP, SPSS) • Two-step clustering (SPSS) • Warning: If there are too many missing data, no clustering algorithm can yield good results.
Eye-balling? • In a two-dimensional data set (X and Y only), you can “eye-ball” the graph to assign clusters. But it may be subjective. • When there are more than two dimensions, assigning by looking is almost impossible.
K-mean • Select K points as the initial centroids • Assign points to different centroids based upon proximity • Re-evaluate the centroid of each group • Repeat Step 2 and 3 until the best solution emerges (the centers are stable)
Neither does this make sense • Johnson-transform Within-cluster SD
Density-based Spatial Clustering of Applications with Noise (DBSCAN) • Groups nearest neighbors together. • Available in SAS/Stat • Invented in 1996 • In 2014 the algorithm won the Test of Time Award at Knowledge Discovery and Data Mining Conference.
Density-based Spatial Clustering of Applications with Noise (DBSCAN) • Unlike K-mean, it may not form an ellipse based on a centroid. • Could be a string-shaped cluster. • Outlier/noise excluded
Hierarchical clustering • Grouping/matching people like what e-harmony and Christian-Mingle do. • Who is the best match? • Who is the second best? The third…etc.
Hierarchical clustering • Top-down or Divisive: start with one group and then partition the data step by step according to the matrices • Bottom-up or Agglomerative: start with one single piece of datum and then merge it with others to form larger groups
Example: Clustering recovering mental patients • What are the relationships between subjective and objective measures of mental illness recovery? • What are the profiles of those recovered people in terms of their demographic and clinical attributes based on different configurations of the subjective and objective measures of recovery?
Objective scale 1: Vocational status The numbers on the right are the original codes. They were recoded to six levels so that the scale is ordinal. e.g. Employed full time at expected level is better than below expected level.
Objective recovery scale 2: Living status The numbers on the right are the original categories. They were collapsed and recoded so that the scale is converted from nominal to ordinal. e.g. Head of household is better than living with family under supervision.
Participants • 150 recovering or recovered patients (e.g. bipolar, schizophrenia) in Hong Kong. • Had not been hospitalized in the past 6 months.
Analysis: Correlations among the scales • The Spearman’s correlation coefficients are small but significant at the .05 or .01 level. However, the numbers alone might be misleading and further insight could be unveiled via data visualization.
Data visualization The participants who scored high in the subjective scale (E2) also ranked high in the current residential status, but they are all over the vocational status, implying that the association between the subjective scale and the vocational status is weak.
Data visualization The reverse is not true. The subjects who scored high in the residential status (3) spread all over in the subjective scale (E2) and the vocational status
Two-step cluster analysis • In this study one subjective and two objective measures of recovery were used to measure the rehab progress of the participants, and thus MANOVA could be used by treating each scale score as a separate outcome measure. • To avoid unnecessary complexity, cluster analysis condenses the dependent variables by proposing certain initial clusters (pre-clusters).
Two-step cluster analysis • Available in SPSS • Use AIC or BIC to avoid over-complexity • Can take both continuous and categorical data (vs. K-mean clustering accepts continuous scales only) • Truly exploratory and data-driven (vs. K-mean prompts you to enter the number of clusters) • Group sizes are almost equal (vs. K-mean groups are highly asymmetrical)
Cluster quality Yellow or green: go ahead Pink: pack and go home
Cluster 5 • In cluster 5 the grouping by vocational is very “clean” or decisive because almost all subjects in the group chose “employed full time at expected level”.
Cluster 5: The best • The clustering pattern suggests that Cluster 5 has the best cluster quality in terms of the homogeneity in the partition. In addition, the subjects in Cluster 5 did very well in all three measures, and therefore it is tantalizing to ask why they could recover so well. • But cluster analysis is a means rather than an end. Further analysis is needed based on the clusters.
Multinomial logistic regression • By default in JMP logistic regression modeling treats the event coded in the last category as the focal interest. However, in this study the most interesting group that the team wants to predict is Cluster 5. Thus, Cluster 6 was recoded to Cluster 0 so that Cluster 5 became the last category. • SPSS allows you to choose the reference group. Why didn't I use SPSS?
ROC Curve • The gray line is the chance model. • Group 0 is the reference • Y: hit • X: miss • Lift the curves towards Y → • more hit, less miss
Heat map again • This is regression. Why do we have Chi-square? • The heat map is a visual version of a cross-tab table. • Chi-sq → fitness of cell counts • Heat map → patterns in cells
Family income: Cause or effect? • Cluster 5 (the best group in terms of both subject and objective recovery) has a significantly higher income level than all other groups. • Plausible explanation 1: they recovered and are able to find a full time job, resulting in more income. • Plausible explanation 2: the family have more money and thus more resources to speed up the recovery process.