Download
1 / 12
120 likes | 149 Vues
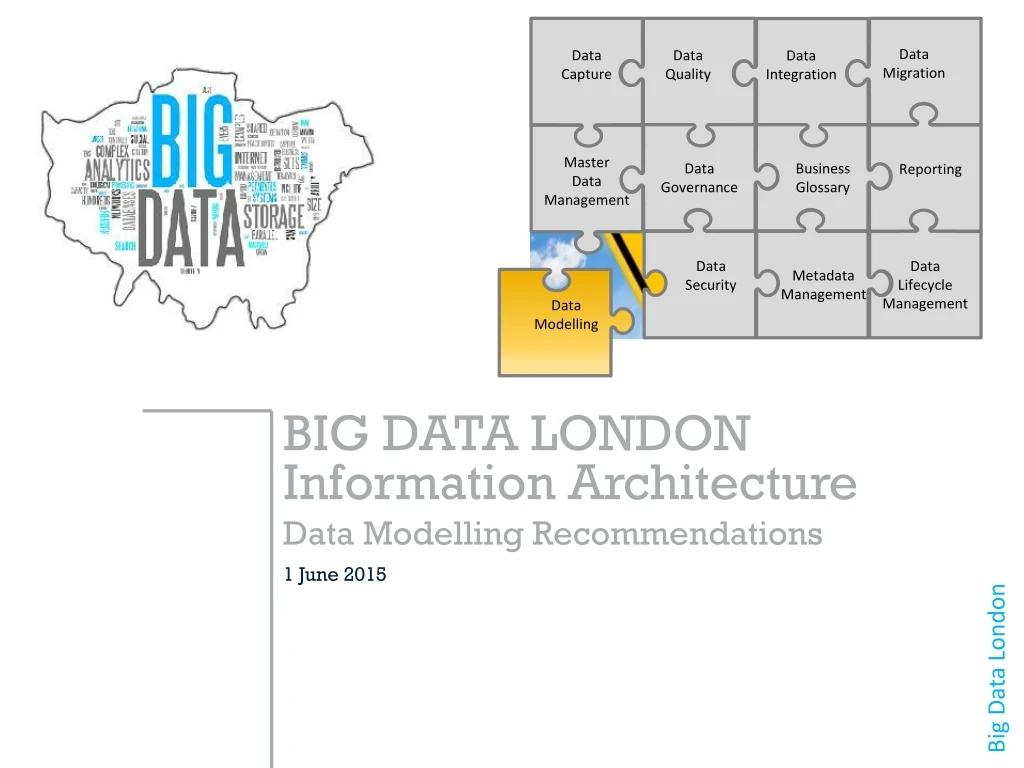
Data Capture. Data Quality. Data Migration. Data Integration. Reporting. Data Governance. Business Glossary. Master Data Management. Data Lifecycle Management. Metadata Management. Data Security. Data Modelling. BIG DATA LONDON Information Architecture

E N D
Data Capture Data Quality Data Migration Data Integration Reporting Data Governance Business Glossary Master Data Management Data Lifecycle Management Metadata Management Data Security Data Modelling BIG DATA LONDON Information Architecture Data Modelling Recommendations 1 June 2015
Background • Data models need to be created whenever a new database is created to store data associated with a particular system, and also in order that business and IT can understand the data that is needed for a particular business process, data integration or reporting • This slide deck explains the practical purpose of each type of data model and modelling technique in order to encourage adoption within delivery projects and architecture • The slide deck does not aim to provide detailed information as to how to produce logical or physical data models, for which information and training courses are widely available.
What is data modeling • Data modelling usually refers to the production of a diagram which presents a set of data objects (entities) and the relationships between them. • There are 3 levels of data models that are usually produced, typically grouped by subject area (see next slide):- • Conceptual data model – This contains just the names of the entities. Relationships between the entities are often omitted at this level. The purpose of a conceptual model is that it’s easy to produce on a sheet of A3/A4 for discussion with the business, whereas the next level down includes attributes making diagrams more complex to read. • Logical data model – This takes the conceptual data model and adds fields (attributes) which contain all of the data that is associated with each entity. A logical data model is system-agnostic so is useful where you want to produce a detailed design for data which is sourced from multiple systems and/or for reporting. The entity attributes in a logical data model are usually defined in a business glossary. • Physical data model – This is the translation of the logical data model in to a model which will be used to create the tables which physically store data within a particular database in the most efficient manner. Another purpose is to allow a technical team to see relationships between physical tables, so that they can integrate or query data. The table columns in a physical data model are usually defined in a data dictionary.
Subject Areas • A data model covering all of the information stored by an organisation would be extremely complex to read even at the conceptual data model level. For this reason, we need to split data models in to subject areas. • A practical choice for a subject area is at a reasonable business capability/process level. For example, if a companyhas level 1 business capabilities of Product Development, Marketing, Sales, Finance etc. then splitting the data model by these subject areas allows teams who work in those areas to more easily validate a data model • A Level 1 business capability is typically still at too high a level, however, as there are a lot of business processes which are incorporated within each of these areas. Working with your business users it is best to split a data model in to subject areas where a business process owner can easily verify that the data that has been modelled for 1 or more business processes is accurate. A conceptual data model is not of practical use, if a business user, working in the subject area that the data model is designed for, cannot verify that the entities are complete and the relationships correct.
Conceptual Data Model – Sales Order Placement example Can buy Date Product Customer Can appear on Can request Can be recorded for Sales Order Can list Entity names should be meaningful to most business users. Where there are multiple names in use within a company, then synonyms/related terms can be listed in the business glossary Arrow heads can indicate whether it’s 1 or many Solid lines can indicate a relationship must exists Dashed lines can indicate a relationship may exist Sales Order Items Note: Data model for illustration purposes only
Logical Data Model – Product Product Group More entities may be added at this stage as more information Is supplied about what needs to be recorded & reported upon Attributes are added to each of the entities described in the conceptual data model with their datatypes e.g. character, integer Primary keys (unique identifying attributes) are identified as well as Foreign keys (attributes which join the entity to another entity) Data Governance concepts e.g.Domains (standard attribute datatypes), default values and validation rules can be added to the design. Attribute descriptions are recorded in a Business Glossary Product Group Identifier Integer PK Product Group Name Varchar (20) Product Group Description Varchar (100) Product Product Identifier Integer PK Product Name Varchar(20) Product Description Varchar (100) Product Group Identifier Integer FK Note: Data model section for illustration purposes only
Physical Data Model – Product PG1A Entities are converted in to physical tables and attributes in to Columns There may be more or less physical tables than corresponding entities, if there are storage or performance benefits Table and Column Names are often abbreviated based on Naming Standards provided via Data Governance. Tables are allocated to physical storage e.g. tablespaces Indexes can be added. Database specific objects e.g. physical storage, data security, Sequences, views can be added Once a physical data model is complete, a database-specific script (known as a DDL) can be created which a DBA runs in order to create the database objects (tables, indexes, sequences, views etc) Column descriptions are recorded in a data dictionary PRD_GRP_ID Integer PK PRD_GRP_NM Varchar (20) PRD_GRP_DESC Varchar (100) Tablespace: TS_MSTRS P1B PRD_ID Integer PK PRD_NM Varchar(20) PRD_DESC Varchar (100) PRD_GRP_ID Integer FK Tablespace: TS_MSTRS Note: Data model section for illustration purposes only
How do you start to produce data models for a business? • There are 2 basic approaches:- • Top-Down – This approach is suitable where you’re adding new functionality to the business for which a database does not already exist, or the existing database is suboptimal. In this approach, you can start either with a blank sheet of paper and work with the business on identifying entities & relationships for a particular subject area or if the subject area is well defined, for example, payments, then you can use a reference data model that’s been created by somebody else • Bottom-Up (Reverse engineering). This approach is suitable where you have a database which already has entities & relationships which you can rely upon. In this method, you import the database objects in to your modelling tool as a physical data model & then reverse engineer a logical data model & a conceptual data model from it. You then modify the data models e.g. to add functionality or standardise naming conventions.
What modelling techniques can you use? • There are 2 common modelling techniques:- • Entity-Relationship Modelling (For example, slide 5 is doing this). In this technique, you identify all of the relationships between all of the entities. This technique is typically used to model data in transactional systems or for operational reporting. It ensures that each data record is recorded only once, so you can ensure that data is always consistent. • Dimensional Modelling. This technique is used for analytical reporting purposes. You have a central fact table e.g. sales_order_facts which contains your business metrics and all entities which you wish to slice and dice those metrics by (known as dimensions) are joined to the fact table. The benefit of this technique is that there are substantially less joins in the data model, allowing data to be queried more efficiently than with E-R modelling. The downside is that you are reliant on a fact event taking place in order to establish relationships between dimensions. E.g. in the model below, there is no relationship between customer and a product until a sale has taken place. Note: Data model for illustration purposes only
FAQ • Why do we need to model data when we’ve bought a pre-built system which we trust and our system experts • know the data? • Business processes generally need to be tailored for each organisation. Since business processes need to at least be • configured, the data that is associated to that bespoke business process should be modelled so that a business user • wishing to produce an operational report can be sure that the data and relationships have been modelled correctly. • A business user wouldn’t typically want to directly query the physical tables in a pre-built system as it would be • difficult to understand. By creating a semantic layer (based on a logical data model) you can provide a means for a • business user to query the data in a more digestible fashion. • A business user may wish to produce reports which contain data from multiple systems. It makes sense again to • create a semantic layer (based on a logical data model) which uses system agnostic terms which the business user • can understand, rather than terms that a particular software vendor may wish to impose. • When integrating data from other systems, the integration architect has to have an understanding as to what • attributes are available at source and where they should be populated in the target system. Mapping data to a • standardised data object (based on a logical data model entity) makes data integration much easier. • When integrating data, the integration architect needs to know the order in which tables should be populated in order that • a child table is only populated after a parent table. Both a logical & physical data model would assist in determining the correct sequencing. • Conclusion: For integration with multiple systems and for reporting, a logical data model should definitely be produced. It is • not necessary to produce a physical data model, where the database is provided by a vendor, but you should • produce a document which maps logical entities & attributes to the underlying physical tables/columns.
Tool Selection Criteria Note: Weightings and Scores should be in range from 0 to 10 with 10 representing a very important criteria (Weighting) and a tool which fully met that criteria (Score)
Tool Selection • Data Modelling tools are relatively mature, and research as to the best products are no longer conducted. Popular data modelling tools are:- • CA Erwin • ER/Studio • SAP Sybase Power Designer • As there are benefits in sharing key entities & their relationships, it is worth selecting a data modelling tool which is the most popular amongst the data modellers across your organisation. This should not take a long time, however as there are a limited number of users and prices are relatively cheap.