Download
1 / 58
580 likes | 786 Vues
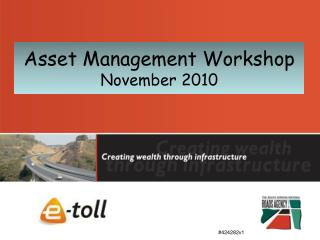
1. The situation is serious but not desperate…. Principal’s Open Fora 3 rd November 2010. 2 A New Economic Landscape. 100%. Asia. 80%. Africa & Latin America. 60%. US, Canada & Oceania. 4 0%. 20%. Europe. 0%. 2000. 2050 (projected). Economic Activity by Region.

E N D
1 The situation is serious but not desperate….. Principal’s Open Fora 3rd November 2010
2 A New Economic Landscape 100% Asia 80% Africa & Latin America 60% US, Canada & Oceania 40% 20% Europe 0% 2000 2050 (projected) Economic Activity by Region Source: Sachs, J. (2008), Common Wealth, Penguin Books.
3 US & UK versus Top Performers 60% 50% 25 to 34 35 to 44 40% 30% 45 to 54 20% 55 to 64 10% 0% US UK Canada Korea Japan Percentage of Adults with a Tertiary Degree by Age Source: OECD, Education at a Glance 2009.
4 Trends in tertiary type A graduation rates – place of the United Kingdom Rank 2000 2003 2004 2005 2006 2007 2008 100% Asia 80% Africa & Latin America 60% US, Canada & Oceania 40% 20% Europe 0% 2000 2050 (projected) Economic Activity by Region Key: CZ, Czech Republic; NL, Netherlands; NZ, New Zealand; SK, Slovak Republic; UK, United Kingdom; USA, United States. Source: OECD (2010) Education at a glance
5 UK Expenditure on tertiary education relative to competitor countries 2007 100% Asia 80% Africa & Latin America 60% US, Canada & Oceania 40% 20% Europe 0% 2000 2050 (projected) Economic Activity by Region Source: OECD (2010) Education at a glance
6 Net public benefit for a male obtaining tertiary education 100% Asia 80% Africa & Latin America 60% US, Canada & Oceania 40% 20% Europe 0% 2000 2050 (projected) Economic Activity by Region Source: OECD (2010) Education at a glance
9 Expansion demand for employment between 2007 and 2017 by occupational group Source: UK Commission for Employment and Skills (2009) Working futures 2007-2017
Planning for the Storm Open Fora 3 November 2010
Puzzle –5 TextAgendaHere Scottish Govnt Context UK Govnt Destination Transition
UK Context • Govnt borrowed hugely to avoid meltdown • Recessionary pressures • Reduced tax take • Increased welfare costs • Increased debt burden • Government’s Financial Imbalance • Balance needs addressed
Clearing the Fog • Hutton (interim) (7 Oct 2010) • Browne (12 Oct 2010) • UK CSR (20 Oct 2010) • Scottish CSR Outline (18 Nov 2010) • Scottish Budget Agreed (March 2011?) • Scottish Elections (May 2011) • Scottish Emergency Budget (June 2011?) • New Scottish CSR (November 2011?)
Puzzle –5 TextUK GovernmentHere Timescale Scale Other issues Context UK Govnt
Scale & Timescale • Timeframe • Current UK Parliament • Assume full term – through ‘till 2014/ 2015 • How much • Scottish Government - c10.8% • Distribution • Protection of priority areas?
Other issues • Browne • Actual implementation • Implications for competitors • Hutton • Climate / necessity for reform
PuzzleScottish GovernmentHere Protection Scale Local Context SFC Options Scottish Govnt Context UK Govnt
Government approach? • Balance in reductions required between • Reasonable annual efficiency gains • Recognition of necessary output reduction • Government will want efficiencies • Without reduction in output • When does efficiency become unreasonable? • After how many years becomes unsustainable?
What Universities get paid for Scotland St Andrews
Who funds Universities Scotland St Andrews
Scottish Funding Council Implementing Scottish Government Higher Education Policy
SFC Options (1) • Salami Slice everything • Shares pain • Requires little thought / justification • 20% off of volumes across the board? • 800 FTE (non controlled student FTEs) • Doesn’t demonstrate strategic leadership • Doesn’t advance Scotland HE • Doesn’t justify existence of SFC
SFC Options (2) 20% cash cut, all from T 20% cash cut, all from R 79% of Total R Public impact on volume? Impact on UStA Lose £14.2m, 37% of SFC Grants • 27% of Total T • c30,000 Student FTEs • Impact on UStA • Lose £5.2m, • 14% of SFC Grants • 1,200 student FTEs • c300 per annum less
SFC Options (3) • Restrict Horizon Fund size • Capital £65m (StA £4.25m – 7% of total) • Revenue £50m (StA £1.1m – 2% of total) • Balance c£15m • Less impact on recurring services • Less opportunity for Govnt initiatives • 3% to 5% annual efficiencies • Minimises scope for volume cuts, esp on T • Cuts in volume could be countered by ‘fines’
SFC Options (4) • Salami Slice on T • Increased excellence focus on R • Minimum proportion of 3* or 4* • Significant impact on less R intensive • Less impact on UStA • Reduced incentive to ‘bulk up’ for REF • Challenge to minimise proportion of 1* & 2*
UStA Total Impact • If Scottish HE cut is 20% • SFC – Cash in 2010/ 11 • £8.5m shortfall • £4m from Aug ‘11, balance over next 2 yrs • Fee consequentials (if numbers cut) • Assume 800 Student FTEs - £1.5m • From Aug ’12 over 4 years • Research Grants – protected? • VAT £0.6m from January 2011 • CRC £0.4m from June 2012
Puzzle –5 TextTransitionHere Rate of cuts Initial plan Scottish Govnt Context UK Govnt Transition
Continuing uncertainty • Need to preserve current ranking • Decisions must deliver strategic goals • Proposed initial measures • With consideration of more radical solutions • But avoid prejudicing strategic decisions
Cost base (2010/ 2011) • Pay – c£95m (58% of total spend) • Non Pay – c£68m (42% of total spend) • Fixed elements £53m and counting……… • Research Grant £12m, • Depreciation £11m, • Scholarships £6m, • Loan Interest £5m, • Energy £5m • Maintenance £4m, • Residences £4m, • Books / Journals £3m • Income related £2m, • Insurance £1m…….
Summary Plan • Phase 1 • Non Recurring Savings • Phase 2 • Improved efficiency • Other targeted measures • Phase 3 – if required • More radical cost reductions
Phase 1 • Initial non recurring measures • Until recurring path agreed • Vacancy Management £3m • Minor Capital £2m • Non Pay £1m • Additional Revenues £1m • Overseas students/ Commercial/ Development
Back office activity • Support staff - 500 FTE across campus • Sharing support between schools (clusters) • Facilities & Systems • Single sources for information • Devolution of expertise / support • Building upon recent projects • Lean, MMS, ASP, Timetabling • Leverage from vacancy management • Potential savings £2m to £3.5m pa
Research Focus • Recognition of change in funding focus • Emphasis on 4* and 3* • Not all academics Grant Active or 4* • Teaching needs and research excellence? • Key research themes within each school • Alignment staff to themes • Identify points of weakness • Focus on sources of grant funding • Cost / benefit analysis of individual pools • Potential savings £1.5m to £3m
Other activities • Overseas Demand • Offset by reducing home numbers? • Renewables • Guardbridge CCHP & Kenly Wind • Commercialisation • StEP, own spin outs • Shared Services • With other public bodies • Development Activity
Underlying issues • Academic prioritisation • Market forces on student numbers • vs artificial protection from current regime • vs ‘academic freedom’ and breadth of offer • Need for rebalancing of T portfolio?
Puzzle –5 TextDestinationHere Vision Status Quo Graduate Contribution Scottish Govnt Context UK Govnt Destination Transition
Strategic Goals • Broadly similar student size • 7,000 to 7,500 FTE, at least 1/3rd Scots • Diverse student background • Broad subject base • Top Research Rated in Scotland • Top Student Rated in Scotland • Consistent league table performance • Top 10 in UK • Top 100 in World
Approach • If funding is cut • Cut service volumes to permit cost cutting • Minimise impact on other income streams • Need to focus resources to retain quality • Academic standards key to decisions • Negative impact on reputation inevitable • Have to sustain programmes through 4 years
Other Issues • Ability to trade up on other subjects • Replace HUG with OS UG • Impact on mix within Schools • Actual Funding Cell • Retention of research area • Ability to trade on non HUG activity • Sustainability of teaching through run down • Emerging market trends


![The Objective Knowledge Growth Framework in [and] Principal ’ s Decision Making: A proposed](https://cdn2.slideserve.com/5195816/the-objective-knowledge-growth-framework-in-and-principal-s-decision-making-a-proposed-dt.jpg)
