Download
1 / 47
480 likes | 870 Vues
El Niño/La Niña and the Southern Oscillation Index (ENSO) . Southern California. ENSO and Southern California Outline. Current ENSO state and predictions ENSO indices/predictions Precipitation and temperature forecasts What is ENSO and how is it measured Basic description of ENSO

E N D
El Niño/La Niña and the Southern Oscillation Index (ENSO) Southern California
ENSO and Southern California Outline • Current ENSO state and predictions • ENSO indices/predictions • Precipitation and temperature forecasts • What is ENSO and how is it measured • Basic description of ENSO • Determination of ENSO • ENSO statistics • Indices • Models • Southern California Observations
Current ENSO State(July 16, 2012) • ENSO Alert System Status: El Niño Watch • ENSO Neutral Index (ONI = -0.1˚C; AMJ 2012) • http://www.cpc.noaa.gov/products/analysis_monitoring/ensostuff/ensoyears.shtml • Forecast:ENSO-neutral conditions continue with chances increasing for El Niño conditions to begin in the July-September 2012 period • Favors near normal rainfall – Jul 2012 • Favors near normal temps - Jul 2012 • Favors mostly above normal temps – Jul-Sep 2012 • Favors near normal rainfall – Jul-Sep 2012
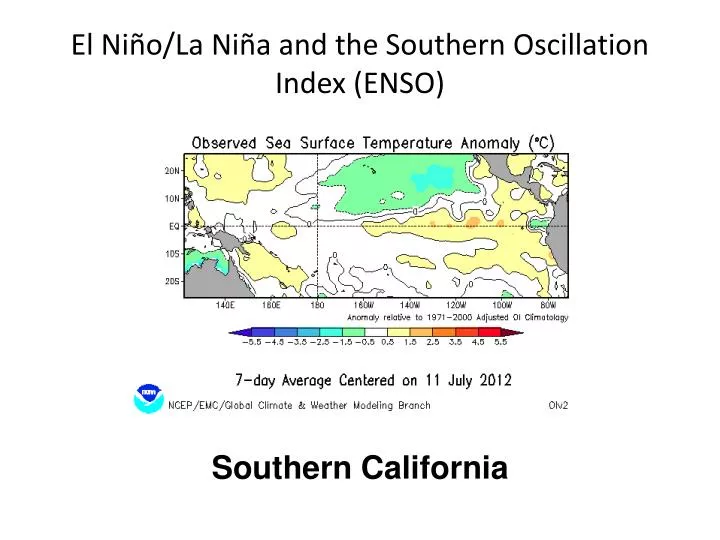
(top) Weekly sea surface temperature (SST) (˚C) centered on 11 July 2012. (bottom) Same as the top except for SST anomalies
The latest weekly SST departures are: Niño 4 0.0ºC Niño 3.4 0.4ºC Niño 3 0.8ºC Niño1+2 0.8ºC
(top) Weekly vertical equatorial temperature anomalies(˚C) centered on 12 July 2012. (bottom) Same as the top except for vertical equatorial temperatures
NCEP Climate Forecast System (CFS) Niño 3.4 SST prediction indicates ENSO neutral conditions will transition to El Niño conditions through September 2012
ENSO Talking PointsENSO Alert System • El Niño or La Niña Watch • Issued when conditions are favorable for the development of El Niño or La Niña conditions within the next three months. • El Niño or La Niña Advisory • Issued when El Niño or La Niña conditions are observed and expected to continue. • Final El Niño or La Niña Advisory • Issued after El Niño or La Niña conditions have ended. • NA: ENSO Alert System is not active
General El Niño Talking Points El Niño refers to a particular climatologicalcondition and not a specific weather event. The term El Niño refers to the large-scale ocean-atmosphere climate phenomenon linked to a periodic warming in sea surface temperatures across the central and east-central equatorial Pacific. El Niño represents the warm phase of the El Niño/Southern Oscillation, or ENSO, cycle, and is sometimes referred to as a Pacific warm episode. Can work to enhance our typical storms. Has greatest impact on Southwest U.S. in the northern Hemisphere winter.ter and spring. Typical El Niño effects include warmer-than-average temperatures over the western and northern United States and wetter-than-average conditions over portions of the U.S. Gulf Coast, California, and Florida, while drier-than-average conditions can be expected in the Ohio Valley and the Pacific Northwest.
Southern California El Niño Talking Points The majority of past strong El Niño’s have a history of much above normal winter rainfall in Southern CA. Weak El Niño’s typically bring wetter-than-average conditions but not always. Moderate El Niño’s typically result in near or slightly above normal conditions. Some El Niño’s have even been drier than normal. El Niño brings an increased threat of heavy rain events, resulting in flooding, debris flows, and higher than normal surf. The debris flow project will continue with the most sensitive areas being this and last year’s fires. Details on this project can be found at: http://www.wrh.noaa.gov/lox/main.php?suite=hydrology&page=debris-flow_project http://www.wrh.noaa.gov/lox/main.php?suite=hydrology&page=debris-flow_project
Southern California El Niño Talking Points Continued El Niño has a repeat cycle of 2-7 years. Avg. = 4 yrs. The recent past strong El Niño’s (57’-58’, 65’-66’, 72’-73’, 82’-83’, 86’-88’, and 97’-98’) have a history of much above normal winter rainfall in Southern CA. Strong El Niño’s Most dramatic effect on local rainfall. Seasonal totals average 150-200% of normal. Less predictable effect in the mountains than at lower elevations for reasons that are not clear. ENSO index stronger than 1.4 Moderate El Niño’s Feature more normal to slightly above normal rain than weak or strong El Niño’s. Seasonal totals average 100-120% of normal. ENSO index 1.0-1.4 Weak El Niño’s Feature an earlier start to the rainy season. Seasonal totals average 120-150% of normal. The reason weaker El Niño’s tend to have a greater effect is poorly understood at this point. ENSO index 05.-0.9
Southern California El Niño Talking Points Continued Weak and strong El Niño’s have produced more rain than moderate El Niño’s. Less consistency exists with regard to temperature. Seasonal rainfall correlations are still being fine tuned as the database of El Niño events continues to develop. Forecasts produced by CPC (Climate Prediction Center) are the official long range forecast. Telephone # 301-763-8000
ENSO Monitoring • El Niño is an oscillation of the ocean-atmosphere system in the tropical Pacific having important consequences for weather around the globe. • Atmospheric and oceanic conditions in the tropical Pacific are monitored by the Tropical Atmosphere Ocean Project maintained by NOAA’s Pacific Marine Environmental Lab (PMEL) that consists of an array of moored buoys shown above
Normal Oceanic Conditions • Warm sea surface temps are common in the western Pacific (Australia, Indonesia, etc.) • Thermocline depth is deep in the Western Pacific and shallow in the Eastern Pacific • Upwelling of cool, nutrient rich ocean water are common in the Eastern Pacific (South America) creating a productive fishery region. • Updrafts and thunderstorms form over the Western Pacific with little activity over the Eastern Pacific.
El Niño Oceanic Conditions • Warm sea surface temps spread across the entire Pacific via the leading front of an oceanic wave. • Thermocline begins to deepen across the Pacific reducing and/or shutting off the upwelling of cool, nutrient rich ocean water along the South American coast reducing fishery productivity with possible fish kills occurring. • Convective events and thunderstorms generation shift eastward over the Central Pacific. • This influences a subtropical jet stream over southern U.S. with storm tracks that normally occur over the Pacific Northwest to be shifted to the south over CA
El Niño/La Niña Classification • Key to defining the strength of a El Niño/La Niña event is the Sea Surface Temperature Anomalies (SSTA). • The main monitoring location for SSTA along the equator is the Niño 3.4 region. • CPC classifies an El Niño with an anomaly of +0.5 or higher for 5 consecutive months. • CPC classifies a La Niña with an anomaly of -0.5 or lower for 5 consecutive months.
El Niño/La Niña Jet Stream • El Niño produces a near horizontal jet stream causing wet conditions in the Southwest • La Niña produces a arching jet stream to the north producing wetter conditions in the Pacific Northwest
Global El Niño Relationships Warm episodes have weather relationships around the globe El Niño effect during December through February El Niño effect during June through August El Niño – Nov 2002
El Niño Signature • El Niño is a temporary but cyclical phenomenon in the equatorial Pacific Ocean, characterized by a positive sea surface temperature departure from normal. • El Niño is considered to be the second biggest climate-related influence on human activities, after the natural flow of the seasons. • Although the phenomenon is at least thousands of years old, its impacts on global climate have only recently been recognized.
1997-1998 Strong El Niño ENSO Index 2.5
Current State ENSO Index -0.1
Historical Pacific warm (red) and cold (blue) episodes based on a threshold of +/- 0.5 oC for the Oceanic Nino Index (ONI) [3 month running mean of ERSST.v3b SST anomalies in the Nino 3.4 region (5N-5S, 120-170W)], based on centered 30-year base periods updated every 5 years. For historical purposes El Niño and La Niña episodes are defined when the threshold is met for a minimum of 5 consecutive over-lapping seasons.
Historical Pacific warm (red) and cold (blue) episodes based on a threshold of +/- 0.5 oC for the Oceanic Nino Index (ONI) [3 month running mean of ERSST.v3b SST anomalies in the Nino 3.4 region (5N-5S, 120-170W)], based on centered 30-year base periods updated every 5 years. For historical purposes El Niño and La Niña episodes are defined when the threshold is met for a minimum of 5 consecutive over-lapping seasons.
Historical Pacific warm (red) and cold (blue) episodes based on a threshold of +/- 0.5 oC for the Oceanic Nino Index (ONI) [3 month running mean of ERSST.v3b SST anomalies in the Nino 3.4 region (5N-5S, 120-170W)], based on centered 30-year base periods updated every 5 years. For historical purposes El Niño and La Niña episodes are defined when the threshold is met for a minimum of 5 consecutive over-lapping seasons.
Historical El Niño and La Niña Episodes Based on the ONI computed using ERSST.v3b
La Niña Years Since 1950 *Weak is Niño Oscillation Index between -0.5 and -0.9. Moderate between -1.0 and -1.4. Strong is greater than -1.4.
El Niño Years Since 1950 *Weak is Niño Oscillation Index 0.5-0.9. Moderate 1.0-1.4. Strong is greater than 1.4.
El Niño/La Niña and Southern California Records clearly show that during almost all El Niño’s, January - March precipitation anomalies are positive Records also clearly show that during almost all La Niña’s J-M precipitation anomalies are negative mm / month
Percent of Normal Rainfall during La Niña/El Niño (for climate division 6) Climate Divisions
Weak El Niño’s feature an earlier start to the rainy season. The pattern becomes more consistent and parallels normal patterns later in winter, with totals settling around 150% of normal, on average.
Moderate El Niños tend to feature a more modest increase in rainfall than weak or strong El Niños. Seasonal totals average around 100-120%. The reason weaker El Niños tend to have a greater effect is poorly understood at this point.
Strong El Niños have the most dramatic effect on local rainfall with seasonal totals averaging 150-200% of normal. Immediate coastal areas tend to see a greater increase in rainfall with lesser effects inland.
Weak El Niños tend to feature higher precip than moderate El Niños. There is more variability with respect to normal in precip before January. Thereafter precipitation tends to level out to a more consistent and steadier pattern, but rates are higher compared to normal. This extends into the Spring. Strong El Niños have a less predictable effect in the mountains than at lower elevations for reasons that are not clear.
The El Niño signal is not quite as consistent in the northern Sierra. • Strong El Niño’s still produce the most precip (125%) but weak and moderate events are similar – near to slightly below normal.
Winter Storms are consistently wetter-than-normal in winter and spring in both weak and strong El Niño’s. • Strong and Weak El Niño’s produce more precipitation than Moderate El Niño’s.
4 out of 5 El Niño years used in this composite were weak events. The fifth was moderate. • This composite shows much closer to normal seasonal rainfall totals than typical weak El Niño’s.
El Niño has a repeat cycle of 2-7 years with an average repeat cycle of approximately 4 yrs.