Download
1 / 25
250 likes | 367 Vues
Evaluating Taxonomies. Agenda. Evaluation overview Editorial evaluation Collection analysis Market analysis Summary and questions. Framework for evaluating taxonomies: How will the taxonomies be used?. Use cases Data management, Data warehouse, MDM, Big data

E N D
Agenda • Evaluation overview • Editorial evaluation • Collection analysis • Market analysis • Summary and questions
Framework for evaluating taxonomies: How will the taxonomies be used? • Use cases • Data management, Data warehouse, MDM, Big data • Business intelligence, Text analytics • eCommerce • Search and browse, Web publishing • Case studies • Healthcare.gov – findable web content, transaction help, customer service • Energy companies – technical training, operational documentation, EHS • Retail and eCommerce – POS, labels, dynamic web content, ecommerce • Financial services organizations – AML, SAR, trading, analysis
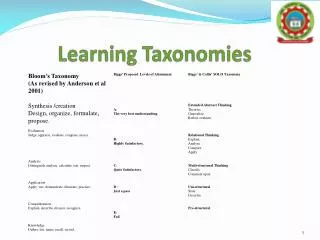
Editorial evaluation • Depth and breadth • Comprehensiveness • Currency • Relationships • Polyhierarchy (is it applied appropriately) • Naming conventions.
Depth and breadth Law Location Role Topic Canada Czech Republic European Union … Attorneys Auditors … Blue Sky Laws CERCLA ERISA … ADR Antitrust Bankruptcy … Location • Africa • Asia • China • Europe • Latin America • Middle East • North America • Canada • Mexico • United States
Taxonomy relationships • CONTENT ITEM • UID / format / filename • Author / title • Description • Dates • Source • Citation Is About Legal Topic And/or Professional Topic Is A Content Type And/or Is A Law & Case Column And/or Is Part Of Organization Collection And/or Is Result Of Geo-Political Activity And/or Is Written For Time Period Segment And/or Is Written For Audience Committee Is Published Via And/or Channel Other Keywords
Taxonomy relationships CONCEPT Fringe parking prefLabel lc:sh85052028 altLabel Park and ride systems altLabel altLabel altLabel Park-n- ride Park & ride prefLabel Park and ride altLabel trt:Brddf CONCEPT
Naming conventions • Label length • Nomenclature • Capitalization • Ampersands • Abbreviations & Acronyms • Languages • Special characters • Serial commas • Spaces • Synonyms • Term order • Term ordering • Compound term labels
Collection analysis • Category usage analytics (is distribution of categories appropriate) • Completeness and consistency • Query log/content usage analysis
Category usage analytics: How evenly does it divide the content? • Documents do not distribute uniformly across categories • Zipf (long tail) distribution is expected behavior • 80/20 Pareto rule in action Leading candidate for splitting Leading candidates for merging
Category usage analysis: How does taxonomy “shape” match that of content? • Background: • Hierarchical taxonomies allow comparison of “fit” between content and taxonomy areas. • Methodology: • 25,380 resources tagged with taxonomy of 179 terms. (Avg. of 2 terms per resource) • Counts of terms and documents summed within taxonomy hierarchy. • Results: • Roughly Zipf distributed (top 20 terms: 79%; top 30 terms: 87%) • Mismatches between term% and document% are flagged in red. Source: Courtesy Keith Stubbs, US. Dept. of Ed.
Completeness and consistency: Indexer consistency • Studies have consistently shown that levels of consistency vary, and that high levels of consistency are rare for: • Indexing • Choosing keywords • Prioritizing index terms • Choosing search terms • Assessing relevance • Choosing hypertext links • Semantic tools and automated processes can help guide users to be more consistent. 30% 80%
Query log analysis: Description of analysis process • Identify top query strings over annual period, average number of words per query and distribution of queries – Are there a few that make up the majority of the total number of queries? • Review each query string to determine what the user is trying to find. Assign a concept/entity. • Each concept/entity is a type of thing. Review each and identify the type or types of things. • Identify the top concepts/entities. • Perform analysis on internal and external queries as appropriate.
Query log analysis: Internal QueriesWords typed into search box on healthcare.gov Aug 2011-July 2012
Query log analysis: Query distributionComparing to Zipf – 80/20 • 80/42 • 80% of the query volume is made up of 42% of the unique queries • 80% of the 84,277 queries is made up of the top 64 unique queries
Market analysis: The best thing about standards is there are so many to choose from • Industry standards/leaders • User surveys • Card sorting • Task based usability.
Completeness and consistency: Blind sorting of popular search terms Results: Excellent 84% of terms were correctly sorted 60-100% of the time. • Difficulties • For Methadone, confusion when, in this case, a substance is a treatment. • For general terms such as Smoking, Substance Abuse and Suicide, confusion about whether these are Conditions or Research topics. 19
Completeness and consistency: Content tagging consensus Results: Good Test subjects tagged content consistent with the baseline 41% of the time. • Observations • Many other tags were reasonable alternatives. • Correct + Alternative tags accounted for 83% of tags. • Over tagging is a minor problem. 20
User labs • What are your primary goals when visiting Nike.com? • Shop • Research • Sports information • Training advice • Other ___________________________________ • Observation on top level of navigation: • What do you expect to find under Product? • What do you expect to find under Sport? • What do you expect to find under Train? • What do you expect to find under Athlete? • What do you expect to find under Innovate? • Scenario 1: what would you click on to find out more about men’s clothing? • On a scale of 1-5 (1 = very difficult, 5 = very easy) did you find it easy to generally locate the object through the diagram navigation path? • 1 2 3 4 5 • Scenario 2: what would you click on to find out how to improve your performance? • On a scale of 1-5 (1 = very difficult, 5 = very easy) did you find it easy to generally locate the object through the diagram navigation path? • 1 2 3 4 5
Hybrid method: “Fashion-forward” product recommendations • Indexes are derived from multiple attributes and sources • Initial weighting can be heuristic and adapted based on user behavior • Index attributes enable analytics and personalization to bootstrap from and leverage Macy’s merchandising expertise • Likert scales (1-5) are sufficient for manually set index attributes • For automated scoring, use more granular, relative scales.
Joseph A Busch, Principal jbusch@taxonomystrategies.com twitter.com/joebusch 415-377-7912 Questions?
Evaluating Taxonomies • Taxonomies are developed in communities and evolve over time. From the outset there is a need to evaluate existing schemes for organizing content and questions about whether to build or buy them. Once built out and implemented, taxonomies require ongoing revisions and periodic evaluation to keep them current and structurally consistent. Taxonomy evaluation includes the following dimensions which will be discussed in this webinar. • Editorial evaluation – including depth and breadth, comprehensiveness, currency, relationships, polyhierarchy (is it applied appropriately), and naming conventions. • Collection analysis - category usage analytics (is distribution of categories appropriate), completeness and consistency, and query log/content usage analysis. • Market analysis – including industry standards/leaders, user surveys, card sorting, and task based usability. • Examples will be provided from public, non-profit and commercial client projects.