Download
1 / 16
160 likes | 266 Vues
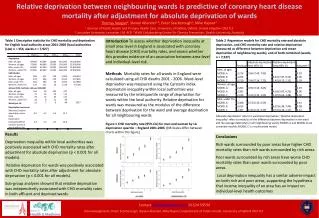
Regional Climate Model Evaluation System based on satellite and other observations for application to CMIP/AR downscaling. Peter Lean 1 , Jinwon Kim 1,3 , Duane Waliser 1,3 , Chris Mattmann 1 , Cameron Goodale 1 , Andrew Hart 1 , Paul Zimdars 1 , Alex Hall 2,3 , Daniel Crichton 1 ,

E N D
Regional Climate Model Evaluation System based on satellite and other observations for application to CMIP/AR downscaling Peter Lean1, Jinwon Kim1,3, Duane Waliser1,3, Chris Mattmann1, Cameron Goodale1, Andrew Hart1, Paul Zimdars1, Alex Hall2,3, Daniel Crichton1, JPL (1), UCLA (2), Joint Institute For Regional EarthSystem Science &Engineering (3)
Motivation • IPCC AR5 has a new emphasis on decadal predictions: • downscaling provides regional details needed for near-term decision support • Model evaluation is crucial to understand strengths and weaknesses of individual models. • JPL/UCLA are collaborating to develop a observation-based regional model evaluation framework for quantifying biases in regional climate model simulations. • Aim: Create a scalable database and processing system to allow researchers to quickly and efficiently confront model output with observations.
A new regional climate model evaluation framework • Goal: • Make the evaluation process for regional climate models simpler and quicker • things that used to take weeks should take days. • Allow researchers to spend more time analysing results and less time coding and worrying about file formats, data transfers. • Benefits: • Improved understanding of model strengths/weaknesses allows model developers to improve the models • Improved understanding of uncertainties in predictions of specific variables over specific regions for end-users
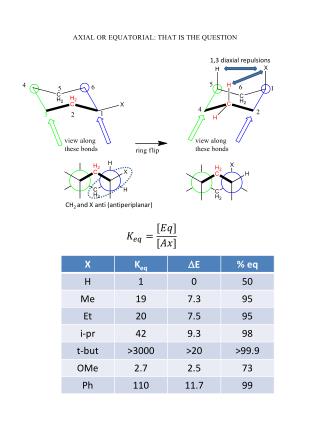
RCMES (Regional Climate Model Evaluation System) High level technical architecture RCMED (Regional Climate Model Evaluation Database) RCMET (Regional Climate Model Evaluation Tool) RCMED: A large scalable database to store satellite, reanalysis and gridded surface data in a common format RCMET: A library of data processing, statistical metric and plotting routines to perform evaluation studies utilizing the database. URL Apache Hadoop
Regional Climate Model Evaluation System overview • User friendly: • No need for users to download large datasets • No need for users to “re-invent the wheel” coding standard metrics • Flexible: • Designed to be relatively easy to add new datasets to the database (extractors written for common formats: netCDF, GRIB, comma-separated ASCII) • Front-end written in Python to take advantage of wide range of existing modules and Fortran bindings. • Expandable: • Database expands over time as researchers add new datasets for their own evaluation studies • Apache Hadoop and MySQL used to provide scalable storage solution. • Statistical processing library expands over time as researchers add new metrics
Datasets included so far: • Datasets that have been included so far: • TRMM (satellite precipitation): [1998– 2010] • AIRS (satellite atmospheric surface + profile retrievals) [2002 – 2010] • ERA-Interim (reanalysis): [1989 – 2010] • NCEP Unified Rain gauge Database (gridded precipitation): • [1948 – 2010] • Snow Water Equivalent (Noah Molotch): [2000-2009] T(2m), T(p), z(p) T(2m), Td(2m), T(p), z(p) Statistical Metrics included: Bias, RMS error, Anomaly Correlation, Pattern Correlation
User experience: Select Observation Dataset: Select model data source: TRMM AIRS level III gridded ERA-Interim URD SWE Select Variable: Surface temperature Precipitation Outgoing LW rad (TOA) Cloud fraction (surface) 10m wind speed Next >
User experience: Select Date Range: Select output grid: Use observational grid Use model grid Other regular grid (specify) Select output plots: Map Time series Select statistical metrics: Select granule size: Mean error RMS error Mean absolute error Anomaly correlation PDF similarity score Coefficient of efficiency Pattern Correlation Seasonal Monthly Pentad Daily Annual Decadal Process
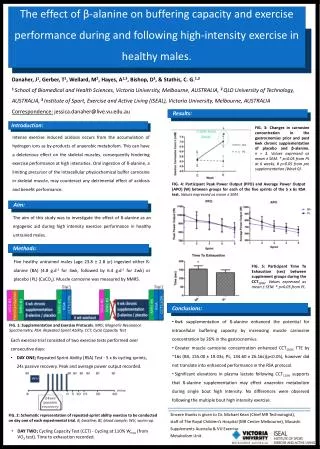
e.g. Comparison of WRF seasonal precipitation with TRMM & URD WRF model TRMM observations URD gridded rain gauge obs Biases Against TRMM Against URD
e.g. Using model data on rotated grid and observations with missing data
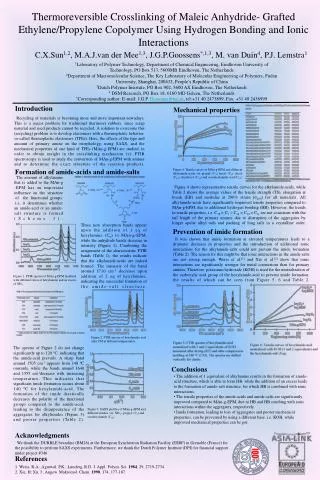
e.g. Metric calculations over masked regions + time series User specified mask WRF URD TRMM NB. TRMM resolution = 0.25° x 0.25° URD resolution = 0.25° x 0.25° WRF resolution = 0.12° x 0.12° (days)
CORDEX collaboration • Co-Ordinated Regional climate Downscaling EXperiment (CORDEX) • Framework to co-ordinate regional modeling activities associated with CMIP5. • Multiple models on standard pre-defined grids. • Vast quantity of model data that requires evaluation. • JPL collaborating with CORDEX project to utilize RCMES in evaluation studies.
Conclusions • JPL/UCLA has designed and developed a new model evaluation framework which can be built upon in the future. • The system has demonstrated the ability to quickly produce comparisons of models against several different observation datasets. • A collaboration has been setup with the CORDEX project to utilize the system to evaluate downscaled CMIP5 projections from multiple models.