Download
1 / 42
760 likes | 2.15k Vues
Chapter 35 - The Short-Run Trade-off between Inflation and Unemployment. Phillips curve - shows the short-run trade-off between inflation and unemployment Inverse relationship, negative correlation between the rate of unemployment and the rate of inflation

E N D
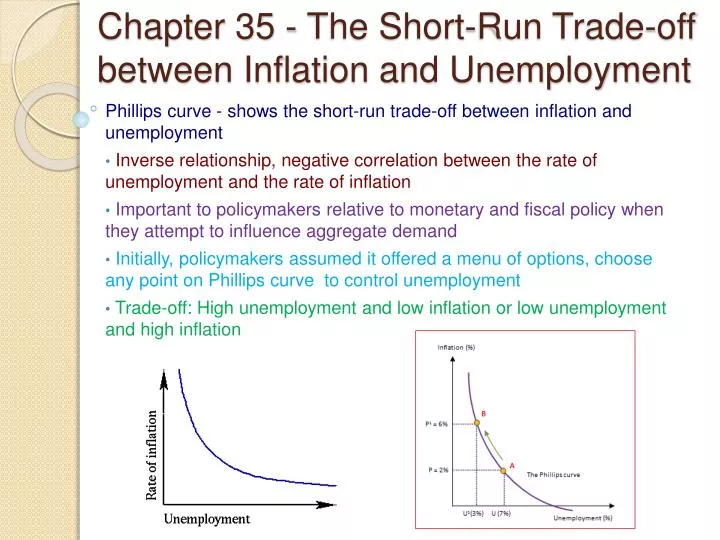
Chapter 35 - The Short-Run Trade-offbetween Inflation and Unemployment Phillips curve - shows the short-run trade-off between inflation and unemployment • Inverse relationship, negative correlation between the rate of unemployment and the rate of inflation • Important to policymakers relative to monetary and fiscal policy when they attempt to influence aggregate demand • Initially, policymakers assumed it offered a menu of options, choose any point on Phillips curve to control unemployment • Trade-off: High unemployment and low inflation or low unemployment and high inflation
The Phillips Curve Inflation Rate (percent per year) B 2% 6% A Phillips curve Unemployment Rate (percent) 7% 4% The Phillips curve illustrates a negative association between the inflation rate and the unemployment rate. At point A, inflation is low and unemployment is high. At point B, inflation is high and unemployment is low.
The Phillips Curve Aggregate demand (AD), aggregate supply (AS), and the Phillips curve • Shifts in the aggregate-demand curve push inflation and unemployment in opposite directions in the short run • Higher aggregate-demand • Higher output & Higher price level • Lower unemployment & Higher inflation • Lower aggregate-demand • Lower output & Lower price level • Higher unemployment & Lower inflation
How the Phillips curve is related to the model of aggregate demand and aggregate supply SRAS (b) The Phillips Curve (a) The Model of AD and AS Inflation Rate (percent per year) Price level B B 106 6% 102 2 AD2 AD1 A Phillips curve A Quantity of output Unemployment Rate (percent) 0 0 16,000 unemployment =4% 15,000 unemployment =7% 4% output =16,000 7% output =15,000
Long-Run Phillips Curve Inflation Rate Long-run Phillips curve • The long-run Phillips curve is vertical • Unemployment - does not depend on money growth and inflation in the long run • We always return to the “natural rate of unemployment”, but at a higher price level • If the Fed increases the money supply • In the short run, unemployment will fall, but inflation rate is high • In the long run unemployment will return to its natural rate High inflation Low inflation 1. When the Fed increases the growth rate of the money supply, the rate of inflation increases . . . B 2. . . . but unemployment remains at its natural rate in the long run. A Unemployment Rate Natural rate of unemployment
Long-Run Phillips Curve • The long-run Phillips curve is the expression of the classical idea of monetary neutrality • Increase in money supply • Interest rates decline and the aggregate-demand curve – shifts right • Price levels (inflation) increase and unemployment decreases in the short-run • Long-run – people come to expect inflation and output returns to natural rate, along with unemployment
Long-Run Phillips Curve and LRAS Price Level • The economy experiences a boom, people have more disposable income to spend Inflation Rate Quantity of Output(Real GDP) Unemployment Rate 0
Long-Run Phillips Curve and LRAS Price Level LRAS LRPC • The economy experiences a boom in the stock market, people have more disposable income to spend Inflation Rate SRAS2 A B SRAS1 B C P3 P1 P2 C 9% 6% SRPC2 A 3% SRPC Quantity of Output(Real GDP) 3% Y2 Yf Yf 5% Unemployment Rate 0 AD2 AD1
Long-Run Phillips Curve and LRAS Price Level • The economy experiences a recession due to reductions in AD. Inflation Rate 0 Quantity of Output(Real GDP) Unemployment Rate
Long-Run Phillips Curve and LRAS LRPC Price Level LRAS • The economy experiences a recession due to reductions in AD. Inflation Rate A B SRAS1 C B C P3 P1 P2 SRAS2 SRPC2 A 3% SRPC 2% Quantity of Output(Real GDP) 8% 1% Y2 Yf Unemployment Rate 0 Yf 5% AD1 AD2
Long-Run Phillips Curve and LRAS LRAS Price Level LRPC • Scenario: The government adopts expansionary fiscal policy because of political pressures and cuts taxes. Show how shifts in the AD curve will affect the Phillips curve. Use 2% as the equilibrium inflation rate and 5% as the natural rate of unemployment. Use 5% inflation after the economy experiences the increase in AD. To fix the inflation problem, the government raises taxes back to their normal rate Inflation Rate A B B P1 P2 SRAS1 5% A SRPC 2% Quantity of Output 3% Y2 Yf Yf 5% Unemployment Rate 0 AD2 AD1
Long-Run Phillips Curve and LRAS • Scenario: The government adopts expansionary fiscal policy because of political pressures and cuts taxes. Show how shifts in the AD curve will affect the Phillips curve. Use 2% as the equilibrium inflation rate and 5% as the natural rate of unemployment. Use 5% inflation after the economy experiences the increase in AD. To fix the inflation problem, the government raises taxes back to their normal rate Price Level Inflation Rate 0 Unemployment Rate Real GDP (Quantity of Output)
Long-Run Phillips Curve and LRAS LRAS LRPC Price Level • Scenario: Assume long run equilibrium. There is an embargo placed on the United States by OPEC nations. Show how shifts in the SRAS curve will affect the Phillips curve. The government increases spending to get unemployment and production back to its natural rate. Inflation Rate SRAS2 A B SRAS1 B C P2 P1 P3 C 9% 5% A SRPC2 2% SRPC AD2 Y2 7% Quantity of Output Y2 Yf Yf 5% AD1 0 UR
Long-Run Phillips Curve and LRAS • Scenario: Assume long run equilibrium. There is an embargo placed on the United States by OPEC nations. Show how shifts in the SRAS curve will affect the Phillips curve. The government increases spending to get unemployment and production back to its natural rate. Price Level Inflation Rate 0 Real GDP (Quantity of Output) Unemployment Rate
Shifts in Phillips Curve: Role of Expectations • Rational Expectations – people will adjust their behavior to expectations of inflation. • Shifts in AD causes movement along the short-run Phillips curve • Shifts to the right cause inflation to increase and unemployment to decrease • Shifts to the left cause inflation to decrease and unemployment to increase
Shifts in Phillips Curve: Role of Expectations • Shifts in SRAS cause a shift in the SRPC • Shifts to the right in SRAS cause shifts to the left in the SRPC • Shifts to the left in SRAS cause cause shifts to the right in the SRPC • SRAS and SRPC are mirror images of each other
Long-Run Phillips Curve Application Scenario: A country’s economy is in a short-run equilibrium with an output level less than the full-employment output level.(recession). Assume an upward-sloping aggregate supply curve. (a) Using a correctly labeled aggregate demand and aggregate supply graph, show the following. (i) Full-employment output, labeled as YF (ii) Equilibrium real output and price level, labeled as YE and PLE, respectively (b) Assume that the country’s government increases domestic military expenditures. On the graph from part (a), show how the increased military expenditures affect the following in the short run. (i) Aggregate demand (ii) Equilibrium real output and price level, labeled as Y2 and PL2, respectively (c) Using a correctly labeled graph of the short-run Phillips curve, show the effect of the increased military expenditures in the short run, labeling the initial point as A and the new point as B.
Long-Run Phillips Curve Application Scenario: Assume that the United States economy is in long-run equilibrium with an expected inflation rate of 6 percent and an unemployment rate of 5 percent. (a) Using a correctly labeled graph with both the short-run and long-run Phillips curves and the relevant numbers from above, show the current long-run equilibrium as point A.
Long-Run Phillips Curve Application The unemployment rate in the country of Southland is greater than the natural rate of unemployment. (a) Using a correctly labeled graph of aggregate demand and aggregate supply, show the current equilibrium real gross domestic product, labeled YC, and price level in Southland, labeled PLC. The president of Southland is receiving advice from two economic advisers—Kohelis and Raymond—about how best to reduce unemployment in Southland. (b) Kohelis advises the president to decrease personal income taxes. (i) How would such a decrease in taxes affect aggregate demand? Explain. (ii) Using a correctly labeled graph of the short-run Phillips curve, show the effect of the decrease in taxes. Label the initial equilibrium from part (a) as point A, and the new equilibrium resulting from the decrease in taxes as point B. (c) Raymond advises the president to take no policy action. (i) What will happen to the short-run aggregate supply curve in the long run? Explain. (ii) Using a new correctly labeled graph of the short-run Phillips curve, show the effect of the change in the short-run aggregate supply you identified in part (c)(i).
Chapter 35 Mankiw Application Worksheet • Describe the initial effect of the following events on the short-run and long-run Phillips curve. That is, describe the movements along a given curve or the direction of the shift in the curve. • An increase in expected inflation causes people to demand higher wages causing firms to decrease production • Shifts short-run Phillips curve to the right (upward). • An increase in the price of imported oil • Shifts short-run Phillips curve to the right (upward). • An increase in the money supply causing unexpected inflation • Movement along and up the short-run Phillips curve. • A decrease in government spending • Movement along and down the short-run Phillips curve. • A decrease in the minimum wage, which lowers the natural rate unemployment • Long-run and short-run Phillips curves shift left (downward).
Chapter 35 Mankiw Application Worksheet • At what point is the economy located if people expect 10 percent inflation and inflation actually is 10 percent? • Answer: E • Referring to (a) above, is unemployment above, below, or equal to the natural rate? • Equal to the natural rate. • At what point is the economy located if people expect 10 percent inflation and the actual rate of inflation is 15 percent? • Answer: D. • Suppose the economy is operating at point D. Over time, in which direction will people revise their expectations of inflation: up or down? • Answer: Up. • Suppose the economy is operating at point D. As people revise their expectations of inflation, in which direction will the short-run Phillips curve shift-right or left? • Answer: Right. • Suppose the economy is operating at point E. In the short run, a sudden decrease in aggregate demand will move the economy toward which point? • Answer: F. • Suppose the economy is operating at point E. In the long run, a decrease in government spending will tend to move the economy toward which point? • Answer: H. • Suppose people expect 5 per cent inflation. If inflation actually ends up being 10 per cent, in which direction will unemployment move: above or below the natural rate? • Answer: Below the natural rate.
Chapter 35 Mankiw Application Worksheet 3. Use a Phillips curve graph to answer the following questions. Assume the economy is initially in long-run equilibrium. • What happens to an economy’s unemployment and inflation rate in the short run if the central bank increases the growth rate of the money supply • Answer: Inflation increases, unemployment decreases. • What happens to an economy’s unemployment and inflation rate in the long run if the central bank increases the growth rate of the money supply • Answer: Inflation increases, unemployment stays at the natural rate. • Can printing money keep unemployment below the natural rate? Explain. • Answer: No. Unemployment temporarily decreases, but as people grow to expect the higher inflation, unemployment returns to the natural rate. • What is the end result of a central bank repeatedly attempting to hold unemployment below the natural rate with expansionary monetary policy? Explain. • Answer: Continued attempts to move unemployment below the natural rate simply causes inflation.
(ii)One point is earned for stating that the Federal Reserve should buy bonds. (iii) Price level will increase because the Federal Reserve action increases interest-sensitive spending (e.g., investment and consumption) and aggregate demand.
• One point is earned for stating that the short-run aggregate supply will increase (shift right) because wages and other input prices will decrease. • One point is earned for stating that the natural rate of unemployment remains unchanged.
2011 (B) One point is earned for stating that transfer payments will increase because more people will apply for government benefits.
2011 (B) One point is earned for stating that the short-run aggregate supply curve will shift to the right because wages and other input costs will fall.
• One point is earned for stating that investment spending will decrease. • One point is earned for explaining that the decrease in investment slows down capital deepening, leading to a reduction in the economic growth rate.
Free Responses • 2005 • 2006 (1) • 2006 (3) • 2006 b • 2008 • 2009 (a) • 2009 (b)
Binder Check • Monetary and Fiscal Policy Scenarios • Free Response Station Work • Daily Tens • Terms • Notes
Upcoming Assignments • 3 Online lecture videos and quizzes – due Thursday. • Prequiz, Chapters 31-32 due Friday.
One point is earned for the correct calculation of the real interest rate: 8% - 6% = 2%.
One point is earned for stating that the Federal Reserve should sell bonds.
One point is earned for stating that aggregate demand decreases. • One point is earned for explaining that the higher interest rate decreases investment and interest-sensitive consumption spending, and that both consumption and investment are components of aggregate demand.
• One point is earned for stating that the short-run Phillips curve will shift to the left, or movement along the curve towards recessionary conditions. • One point is earned for explaining that Federal Reserve policy will lower inflationary expectations so the economy will slow. • One point is earned for stating that the natural rate of unemployment will remain unchanged in the long-run.