Download
1 / 26
260 likes | 348 Vues
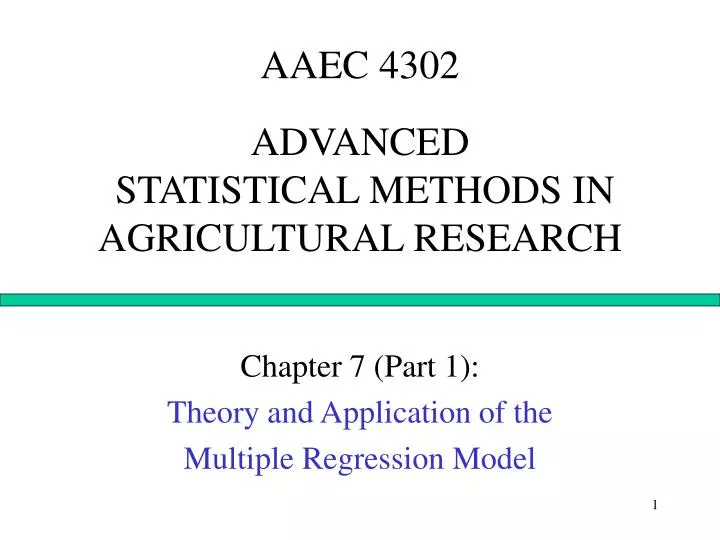
AAEC 4302 ADVANCED STATISTICAL METHODS IN AGRICULTURAL RESEARCH. Chapter 7 (Part 1): Theory and Application of the Multiple Regression Model. Introduction. When we have one independent variable (X) we called it a Simple Regression Model.

E N D
AAEC 4302ADVANCED STATISTICAL METHODS IN AGRICULTURAL RESEARCH Chapter 7 (Part 1): Theory and Application of the Multiple Regression Model
Introduction • When we have one independent variable (X) we called it a Simple Regression Model. • When there is more than one independent variable, it is called Multiple Regression.
Introduction • We postulate that cotton yields are a function of: • Irrigation water applied • Phosphorus fertilizer applied • We can write this mathematically as: Y = B0+B1X1+B2X2+ui
Introduction • Y = B0+B1X1+B2X2+ui • Y = Cotton Yield (lint in lbs/ac) • X1 = Irrigation Water Use (in/ac) • X2 = Phosphorus Fertilizer use (lbs/ac)
Introduction • The multiple regression model aims to and must include all of the independent variables X1, X2, X3, …, Xk that are believed to affect Y. • Their values are taken as given: It is critical that, although X1, X2, X3, …, Xk are believed to affect Y, and • Y does not affect the values taken by them.
Introduction • The multiple regression model is given by: Yi = B0+B1X1i+B2X2i +B3X3i+…+BkXki +ui • where i=1,…,n represents the observations; • k is the total number of independent variables in the model; • B0, B1,…,Bk are the parameters to be estimated; • ui is the population error term, with the same properties as in the simple regression model.
The Model • As before: E[Yi] = B0+B1X1i+B2X2i +B3X3i+…+BkXki Yi = E[Yi] + ui, systematic unsystematic • the systematic (explainable) and unsystematic (random) components of Yi
The Model • The model to be estimated, therefore, is And the corresponding prediction of Yi:
Model Estimation • Also as before, the parameters of the multiple regression model (B0, B1, B2, B3,…,Bk) are estimated by minimizing SSR, • that is, the sum of the squares of the residuals (ei),or differences between the values of Y observed in the sample, and the regression line (i.e. the OLS method):
Model Estimation • As before, the formulas to estimate the regression model parameters that would make the SSR as small as possible are obtained by taking derivatives
Model Estimation • Specifically, the k+1 partial derivatives of the just discussed SSR function, with respect to: , are taken and set equal to zero. • This results in a system of k+1 linear equations with k+1 unknowns (the β’s).
Model Estimation • Solving this systems for the unknowns, yields the formulas for calculating: , which depend on the Yi and the X1i, X2i, X3i, …, Xki values in the sample. • The formulas for the case where there are only two independent variables (X1 and X2) in the model are given in the next slide.
Model Estimation Page 134:
Y X2 Regression surface (plane) E[Y] = Bo+B1X1+B2X2 Ui X2 slope measured by B2 Bo X1 slope measured by B1 X1
Model Estimation • Notice that when there are two independent variables in the model, the formula for calculating is not the same as when there is only one independent variable. • Therefore, the estimated value of this parameter will be different if X2 is not included in the model.
Model Estimation • In general, only a model that is estimated including all of the (independent) variables that affected the values taken by Y in the sample will produce “correct” parameter estimates. • Only then will the formulas for estimating these parameters be unbiased.
Interpretation of the Coefficients ^ • The intercept B0 estimates the value of Y when all of the independent variables in the model take a value of zero; • which may not be empirically relevant or even correct in some cases.
Interpretation of the Coefficients ^ ^ ^ • In a strictly linear model, B1, B2,..., Bk are slope coefficients that measure the unit change in Y when the corresponding X (X1, X2,..., Xk) changes by one unit and the values of all of the other independent variables remain constant at any given level (it does not matter which level).
The Model’s Goodness of Fit • The key same measure of goodness of fit is used in the case of the multiple regression model: • The only difference is in the calculation of the ei’s, which now equal
The Model’s Goodness of Fit • The interpretation and everything else is the same as in the case of the simple linear regression model • The SER is also calculated as before, but using the ei’s above and dividing by n-k-1
The Model’s Goodness of Fit • A disadvantage of R2 as a measure of a model’s goodness of fit is that it tends to increases in value as independent variables are added into the model, even if those variables can’t be statistically shown to affect Y. Why? • This happens because, when estimating the model’s coefficients by OLS, any new independent variable would likely allow for a smaller SSR
The Model’s Goodness of Fit • An increase in the R2 as a result of adding an independent variable to the model does not mean that the “expanded” model is better, or that that variable really affects Y (in the population)
The Model’s Goodness of Fit • The adjusted R2 denoted by R2is a better measure to assess whether the addition of an independent variable increases the ability of the model to predict the dependent variable Y.
The Model’s Goodness of Fit • R2 is always less than the R2, unless R2 = 1 • Unfortunately, R2 lacks the same straightforward interpretation as R2; under unusual circumstances, it can even be negative. • It is only useful to assess whether an independent variable should be added to the model.
The Specification Question • Any variable that is suspected to directly affect Y, and that did not hold a constant value throughout the sample, should be included in the model. • Excluding such a variable would likely cause the estimates of the remaining parameters to be “incorrect”; i.e. the formulas for estimating those parameters would be biased.
The Specification Question • The consequences of including irrelevant variables in the model are less serious • if in doubt, this is preferred • If a variable only affects Y indirectly, through another independent variable in the model, it should not be included in the model.