Download
1 / 59
590 likes | 776 Vues
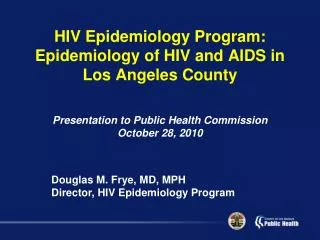
HIV, AIDS and HIGH RISK BEHAVIORS among BEHAVIORAL RISK GROUPS in LOS ANGELES COUNTY. As presented by Dr. Douglas Frye to the PPC on January 6, 2004 ~ Revised to include Transgender BRG ~ HIV Epidemiology Program Los Angeles County Department of Health Services Public Health.

E N D
HIV, AIDS and HIGH RISK BEHAVIORS among BEHAVIORAL RISK GROUPS in LOS ANGELES COUNTY As presented by Dr. Douglas Frye to the PPC on January 6, 2004 ~ Revised to include Transgender BRG ~ HIV Epidemiology Program Los Angeles County Department of Health Services Public Health
Outline • Estimates of BRG populations • HIV and AIDS Estimates for BRGs based on HARS • New HIV Infections at State-funded Testing Sites • Distribution of persons living with AIDS by BRG, Service Planning Area, and Race/Ethnicity • High risk behaviors in BRGs • Transgendered persons • American Indians/Alaskan Natives
Estimated Population Size of Behavioral Risk Groups - LAC, as of 2000
HIV and AIDS Estimates for BRGs Based on HARS(HIV/AIDS Reporting System)
Persons Living with AIDS by Behavioral Risk Group - LAC HARS, as of 2/28/03
Estimated Number of Persons Living with HIV (including AIDS) by BRG 28,400 # BRG with AIDS 6,400 4,200 4,200 3,100 1,700 1,700
Proportion of Persons Living with HIV and AIDS by BRG - LAC, 2003 3% 4% 3% 6% 8% 55% 8% 12%
Proportion of Estimated Annual HIV Incidence by BRG - LAC, 2003 3.5% 6% 8.5% 3% 6% 53.5% 6% 13.5%
Estimated Annual HIV Incidence Proportion of All BRGs - LAC, 2003 4% 9% 3% 6% 6% 57% 15%
Number of Persons Living with AIDS in LAC by BRG and Service Planning Area * *HARS data as of 2002; does not include 801 cases with unknown SPA.
Source: Data Analysis Unit, HIV Epidemiology Program
Persons Living with AIDS in LAC Percent BRG by Service Planning Area* *HARS data as of 2002; does not include 801 cases with unknown SPA.
Estimated HIV Seroprevalence (including AIDS) by BRG in LAC - as of 2/28/03 % living with AIDS 18% 17% 13% 8.7% 6.5% 3.9% 2.1% Source: HIV Epidemiology Program, LAC/DHS.
Rate of New HIV Infections among Repeat Testers at State-funded Test Sites by BRG - LAC, 1997 - 2001 N= 48 N= 653 N= 113 N= 20 N= 10 N= 81 N= 36 Behavioral Risk Group Source: OAPP and HIV Epidemiology Program. *TG refers to new infections among transgendered females. There were no new infections among transgendered males.
Rate of New HIV Infectionsamong Repeat Testers at State-funded HIV Test Sites by Race/Ethnicity and BRG - LAC, 1997 - 2001 White * Black * Latino * * * * *= Statistically higher rate than non-starred race/ethnicity within BRG Source: OAPP and HIV Epidemiology Program, LAC/DHS.
1 2 3 4 5 6 7 8 Percent Tested and Testing Positive at State-funded Test Sites by SPA - LAC, 2001 Tested (N = 44,951) Testing Positive (N = 614) Service Planning Area Source: OAPP, LAC/DHS.
Percent Tested and Testing Positive at State-funded Test Sites by BRG - LAC, 2001 Tested (N = 44,967) Testing Positive (N = 657) Source: OAPP, LAC/DHS.
Percent Tested and Testing Positive at State-funded Test Sites by Race/Ethnicity - 2001 Tested (N = 44,967) Testing Positive (N = 657) Race/Ethnicity Source: OAPP, LAC/DHS.
Persons Living with HIV and AIDS Proportion by Behavioral Risk GroupLos Angeles County, 2003 54% MSM
MSM Living with AIDS by SPA and Race/Ethnicity - as of 12/31/02 N=4,516 N=1,826 N=1,346 N=576 N=636 N=649 N=538 N=81
MSM Living with AIDS by SPA and Race/Ethnicity - as of 12/31/02
Persons Living with HIV and AIDS Proportion by Behavioral Risk GroupLos Angeles County, 2003 MSM/W 12%
MSM/W Living with AIDS by SPA and Race/Ethnicity - LAC, as of 12/31/02 N=627 N=352 N=259 N=247 N=184 N=148 N=81 N=27
MSM/W Living with AIDS by SPA and Race/Ethnicity - LAC, as of 12/31/02
Men who have sex with men and are injection drug users (MSM/IDU)
Persons Living with HIV and AIDS Proportion by Behavioral Risk GroupLos Angeles County, 2003 MSM- IDU 6%
MSM-IDU Living with AIDS by SPA and Race/Ethnicity - LAC, as of 12/31/02 N=407 N=225 N=121 N=75 N=46 N=58 N=43 N=12
MSM - IDU Living with AIDS by SPA and Race/Ethnicity - LAC, as of 12/31/02
Persons Living with HIV and AIDS Proportion by Behavioral Risk GroupLos Angeles County, 2003 8% HMIDU
HMIDU Living with AIDS by SPA and Race/Ethnicity - LAC, as of 12/31/02 N=261 N=245 N=144 N=141 N=91 N=64 N=40 N=27
HMIDU Living with AIDS by SPA and Race/Ethnicity - LAC, as of 12/31/02
Persons Living with HIV and AIDS Proportion by Behavioral Risk GroupLos Angeles County, 2003 3% FIDU
FIDU Living with AIDS by SPA and Race/Ethnicity - LAC, as of 12/31/02 N=107 N=101 N=81 N=62 N=57 N=30 N=21 N=8
FIDU Living with AIDS by SPA and Race/Ethnicity - LAC, as of 12/31/02
Persons Living with HIV and AIDS Proportion by Behavioral Risk GroupLos Angeles County, 2003 8% WSR
WSR Living with AIDS by SPA and Race/Ethnicity - LAC, as of 12/31/02 N=236 N=221 N=222 N=157 N=134 N=97 N=45 N=21
WSR Living with AIDS by SPA and Race/Ethnicity - LAC, as of 12/31/02
MSMIDU, MSM*, MSMW*: Unprotected Anal Receptive Sex in Last 6 Months by BRG LA Young Men’s Survey, 1999 - 2000 * MSMW self-identified as bisexual; MSM as gay or homosexual.
Percent MSM Living with AIDS Reporting Unprotected Anal Intercourse (UAI) at Last Sex and Reporting 10+ Sex Partners in Last Year Los Angeles SHAS, 1998 - 2003 = UAI at last sex = 10+ partners/year (4)
Percent Unprotected Anal Receptive Sex Last 12 Months Among PLWA by BRGLos Angeles SHAS, 2000 - 2003
MSMIDU, MSM, MSMW: Percent Having Sex by Type of Partner - APLA, 2001 Note: “Gay” = MSM; “Bisexual” = MSMW; “Gay IDU” = MSMIDU
Percent Ever had an STDby Behavioral Risk Group Los Angeles SHAS, 2000 - 2003