Download
1 / 33
330 likes | 463 Vues
Functional Neuroanatomy of Lexical processing in children with cleft lip and palate (CCLP). Becker et al., 2007. Background. Males are affected more often than females. Incidence in: Asian population = 1 in 500 births. Caucasian and Hispanic populations = 1 in 1000 births.

E N D
Functional Neuroanatomy of Lexical processing in children with cleft lip and palate(CCLP) Becker et al., 2007
Background Males are affected more often than females. Incidence in: • Asian population = 1 in 500 births. • Caucasian and Hispanic populations = 1 in 1000 births. • African American population = 1 in 2000 births. (Altemus & Ferguson, 1965; Chung et al., 1986; Natsume & Kawai, 1986; Vanderas, 1987)
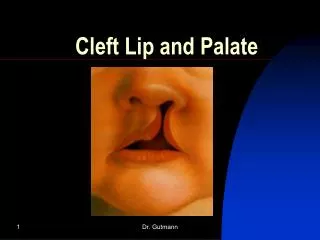
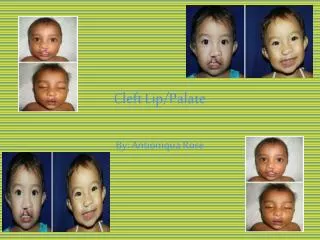
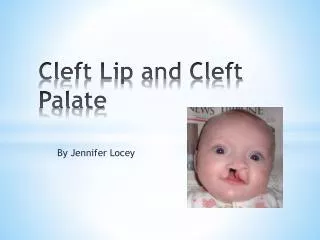
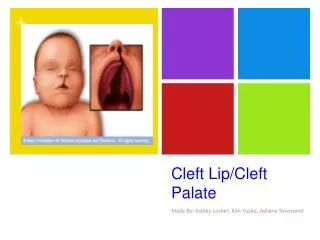
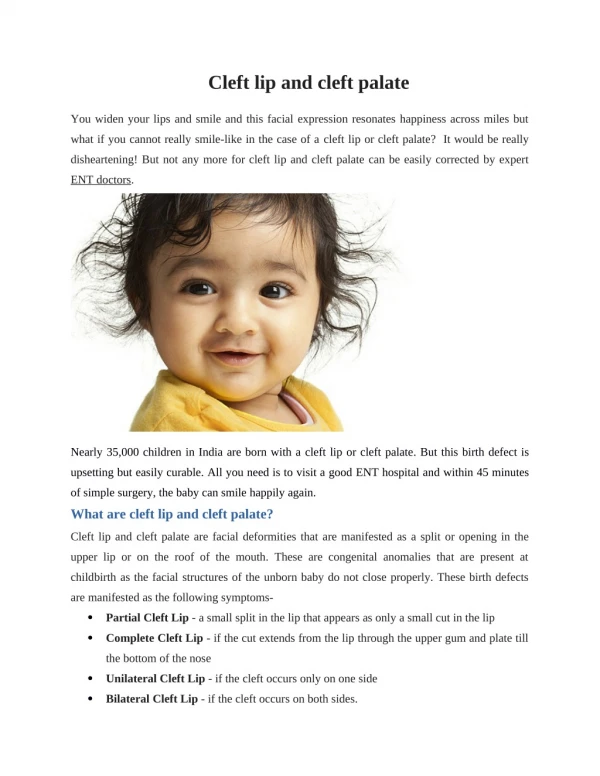
Cleft Lip & Palate Cleft lip may occur in isolation or together with cleft palate and vice versa. Incidence of cleft lip alone (15-20%) is lower than the incidence of cleft palate only (30-35%) and cleft lip and palate (50%). (Coccia et al., 1969; Woolf et al., 1963)
Cleft Lip & Palate • Occurrence of cleft lip and palate together is more common in males. • Cleft palate only is more common in females (Calzolari et al., 1988; Womersley & Stone, 1987)
Types of Clefts Common • Unilateral (9x as common as bilateral and occurs more often on the left side) • Bilateral Often involve deformity of the nose Unilateral Bilateral
Types of Clefts Rare • Median • Facial (DeMyer, 1971; Tessier, 1976)
When do they form? Between fourth to eight week of embryonic development. Earlier malformations are more severe than later ones
Causes Genetic Increased incidence in children with a parent or sibling who are similarly affected ⇒ 1 in 131(Melnick, 1986). Orbital cleft Note: Individuals with cleft palate only have higher percentage of siblings that have other types of malformations than individuals with cleft lip only or cleft lip and palate (Meskin & Pruzansky, 1969. (Malformations can occur in the orbital cleft, facial asymmetry, middle ear defects, sternum).
Causes Environmental • Antiepileptic drug, phenytoin = 10-fold increase in the incidence of clefts. • Smoking during pregnancy = 50% to 70% increase in clefting compared to those born to nonsmoking mothers. • Certain viruses (rubella and influenza) increase risk of clefting.
Associated Anomalies Clefting occurs in about 250 syndromes including Van der Woude, Stickler syndrome, microcephaly, etc. Van der Woude microencephaly Stickler
Associated problems 1) Feeding 2) Ear infection- hearing loss 3) Speech and language disorders 4) Dental problems
Treatment Surgery NAM – Nasal alveolar molding
Anatomical differences Adult males with cleft palate display: 1) smaller cerebellum 2) smaller temporal lobe 3) smaller occipital lobes 4) larger frontal lobes * Proportional gray and white matter (Nopoulos et al., 2000)
Language Development • Early deficits in cognitive development (Fox et al., 1978; Snyder & Scherer, 2004; Speltz et al., 2000). • Problems with syntax, short length of utterance and delays in expressive language (Horn, 1972; Morris, 1962; Withcomb et al., 1976). • Articulation disorders, sometimes even after the cleft is repaired (Jones et al., 2003; O’Gara & logemann, 1988).
Method Participants
Experimental design • Total of 6 runs. • Each run consisted of 21 stimuli - one discrete task and one modality. * Presentation was jittered – stimulus was presented every 2nd, 3rd, 4th MR frame in pseudorandom fashion.
Movement analysis Motion in the scanner can be a problem. If more than 1.5 mm (RMS value) was needed to realign head movement, the data was excluded. Image analysis General Linear Model for event related data. Time = 7-level factor (BOLD measures every 3.08 seconds). Removed outliers = time course that had greater than 2% change in signal.
Overlap analysis Compared with Brown et al. (2005) study. Brown et al. 2005 (used the same tasks) • Age-related regions = regions that showed increased or decreased activity with age. • Performance-related regions = regions that were related to performance ability. • Age-and performance-independent regions.
Developmental analysis To determine if age had an effect. Each CCLP was compared to an age-matched cohort (group of 20 control individuals matched within 2 years). Statistical analysis Repeated measures analysis – mixed model. Between subject factor = condition or group (with or without cleft lip and/or palate) Within subject factor = time
Results Results were based only on correct responses. **Reaction time (collapsed across task and modality) Experimental: 1813 msec Control: 1804 msec ** not statistically different
Main Effect of Time To determine how reliably each voxel was activated by the tasks. Regions activated were similar to previous study (Schlagger et al., 2002) looking at single word processing.
Main effect: voxels reliably activated across all subjects and all tasks
Group x time interaction There were several regions that displayed activation differences related to: 1) latency (CCLP > control) 2) duration (CCLP >control) 3) magnitude
Right parietal precuneus Right inferior frontal gyrus Higher magnitude in CCLP Left superior medial frontal gyrus
Lower magnitude in CCLP Right middle temporal gyrus * Right lateral prefrontal cortex – not shown Left inferior frontal gyrus
Similar in CCLP and controls Left cingulate gyrus * left paracentral lobule, right superior temporal gyrus – not shown
Not activated in CCLP Right middle frontal gyrus
Developmental Analysis 9 out of 12 CCLP showed regions that had differences in BOLD responses from their age-matched cohorts. Older participants (>14.5 years) showed differences consistently in the right frontal cortex (n=2) and ACC (n=1) when compared to controls.
Group x time: regions that were statistically different in BOLD response between groups
* Functional differences between CCLP and control increase with age. Average number of regions where the BOLD responses that differed from the controls Older (above 14.5 years) = 8.4 Younger (below 14.5 years) = 2.6
CCLP show substantial variability in activation regions when compared to controls lateral medial posterior Pink: CCLP ≠ control (Are there more blue than pink regions in the older participant?) Blue: CCLP = control posterior
Discussion CCLP have similar but non-identical functional neuroanatomy during language tasks at comparable levels of performance. Regional differences in functional neuroanatomy are more apparent in age/performance related areas. CCLP display increasing differences in age-related regions with increasing age. CCLP display novel organization during language tasks