Download
1 / 44
480 likes | 745 Vues
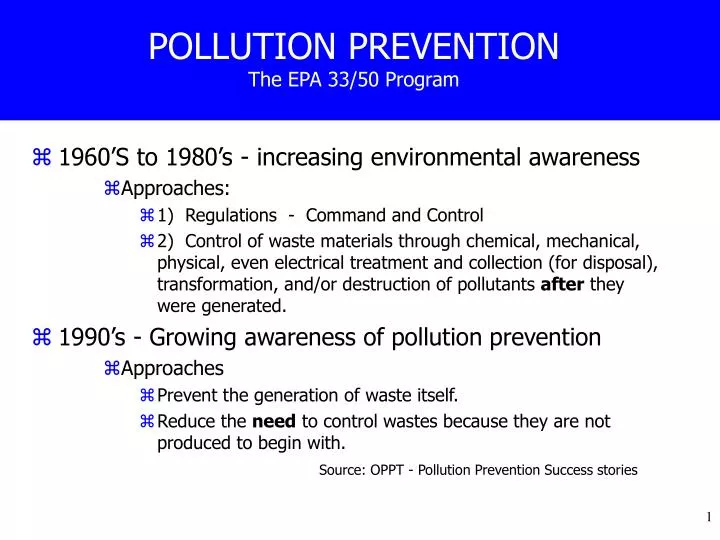
POLLUTION PREVENTION The EPA 33/50 Program. 1960’S to 1980’s - increasing environmental awareness Approaches: 1) Regulations - Command and Control

E N D
POLLUTION PREVENTIONThe EPA 33/50 Program • 1960’S to 1980’s - increasing environmental awareness • Approaches: • 1) Regulations - Command and Control • 2) Control of waste materials through chemical, mechanical, physical, even electrical treatment and collection (for disposal), transformation, and/or destruction of pollutants after they were generated. • 1990’s - Growing awareness of pollution prevention • Approaches • Prevent the generation of waste itself. • Reduce the need to control wastes because they are not produced to begin with. Source: OPPT - Pollution Prevention Success stories
POLLUTION PREVENTION: Definition • Prevention takes many forms: • Buying correct amount so no excess materials need to discarded. • Producing less wastewater by better controlling the amount of water used in cleaning or manufacturing. • Substituting non-toxic chemicals for hazardous or toxic materials currently used in processes. • Re-engineering and redesigning manufacturing processing lines to take advantage of newer, clear process equipment. Source: OPPT - Pollution Prevention Success stories
Pollution Prevention Act of 1990 • National Policy of the US • Pollution should be prevented or reduced at source whenever feasible • Pollution that can not be prevented should be recycled in an environmentally safe manner where feasible • If pollution cannot be recycled or prevented it should be handled in an environmentally friendly way • Disposal or release to the environment should be employed as a last resort and should be conducted in an environmentally friendly manner. 42 USC §§13101-13109
Voluntary Overcompliance • Voluntary Overcompliance is a recent phenomenon. • If the law requires toxic emissions reductions of 50% some firms pledge to reduce more • A firm overcomplies when they go beyond a stated law or regulation voluntarily. Source: Journal of Environmental Economics and Management 28, 271 -286 (1995)
Voluntary Overcompliance • Factors leading to Overcompliance • Dynamic nature of game between firms and enforcement agency • Violators are threatened with perpetual surveillance so, even though the penalty is less than the cost of compliance, firms comply and often go beyond compliance. Source: Journal of Environmental Economics and Management 28, 271 -286 (1995)
Voluntary Overcompliance • Preference for environmental quality by consumers may combine with competition and induce some firms to overcomply • Increased public scrutiny has led some firms to self-impose stringent emissions standards. • Information about a firm’s environmental record is now available as part of Toxic Release Inventory. • Growth in overcompliance coupled with consumer desire for environmental quality. • Evidence is showing that those companies that make the investment to change early are much better off. Source: Journal of Environmental Economics and Management 28, 271 -286 (1995)
33/50 Climate Wise Energy Star Environmental Accounting Stewardship Program Project XL Pesticide Environmental Stewardship Program WasteWise Water Alliances for Voluntary Efficiency EPA’s Partners for the EnvironmentExamples of Voluntary Programs Source:http://www.epa.gov/ooaujeag/partners/metrics.html
EPA’s Partners for the EnvironmentVoluntary Programs • 1997 - Partners grew from 6,882 to 8,030 • Members from every sector of the economy • Fortune 500 companies as well as small companies • Collectively these business saved $1.6 billion • Achieved measurable environmental results with lower costs Source:http://www.epa.gov/ooaujeag/partners/metrics.html
EPA’s Partners for the EnvironmentVoluntary Programs in Action • 1997 Success Highlights • Reduced greenhouse gas emissions by preventing 79 million metric tons of CO2 per year (tripled results from 1996) • Saved 5.8 million gallons of clean water • Prevented 7.6 million tons of solid waste from entering landfills • Saved 1,020 trillion BTU’s - enough to light 56 million households for a year Source:http://www.epa.gov/ooaujeag/partners/metrics.html
Toxic Release Inventory(TRI) • TRI data collected focuses on source reduction activities • TRI is voluntary based, rather than risked based measure of pollution (exposure levels are not considered) • Facilities which manufacture or process more than 25,000 pounds or use more than 10,000 pounds of any reportable chemical must submit a TRI report for each chemical Source: Journal of Environmental Economics and Management 28, 271 -286 (1995)
Toxic Release Inventory(TRI) • Data collected includes information on release into all media: air, land, (on-site land, underground injection wells and off-site transfers) and water. • Due to the public nature of the data collected and reported, the TRI may be the most significant measure of industry’s overall progress in reducing wastes and releases. Source: Journal of Environmental Economics and Management 28, 271 -286 (1995)
TRI Data TRI data show aggregate year to year decreases in releases and transfers of more than 320 chemicals Decreases in Releases/Transfers 1988 - 1991 -31% / -34% 1990 - 1991 -9% / -19%
Toxic Release Inventory(TRI) Limitations • TRI data set is self-reported, therefore there exists an incentive to under-report the releases. • May also be an incentive to over-report if firms expect to be rewarded for improvements to a baseline emission level. Source: Journal of Environmental Economics and Management 28, 271 -286 (1995)
TRI Critics of TRI suggest that changing database, different reporting requirements, and production volume decreases, rather than real pollution prevention, are the primary reasons that decreases are being seen in releases. Source: July 26, 1993 C&EN
TRI, Pollution Prevention Act and 33/50 Program • Connections: • There was anecdotal evidence that the publication of the TRI data in 1988 “shamed” several top polluting firms to voluntarily reduce toxic releases. • The 33/50 program was developed in part to take advantage of this “voluntary sentiment” and its design was influenced by the Pollution Prevention Act 1990.
Chemical Industry • Leads all the other industries in releases @1.5 billion pounds in 1991 • 90% of chemical manufacturing belongs to Chemical Manufacturers Association (CMA) Source: July 26, 1993 C&EN
CMA • CMA adopted Responsible Care Program (1988) • Companies should strive for annual reduction, recognizing that production rates, new operations, and other factors may result in increases. Despite these fluctuations, the goal is to establish a long-term, downward trend in the amounts of waste generated and contaminants and pollutants released. • Uses the TRI to measure progress • Adherence to Responsible Care is a condition of membership in CMA Source: July 26, 1993 C&EN
33/50 and CMA • EPA’s 33/50 program, which CMA supports as consistent with Responsible Care, is an example of a program where the focus has shifted from volume to environmental impact. • It may be better in the overall scope of things to spend $ to reduce smaller volumes of highly toxic chemicals rather that focusing on those produced merely by highest volume. • Source July 26, 1993 C&EN
Overview of the 33/50 Program • EPA initiated 33/50 program in Feb. 1991 • Designed to reduce releases and transfers of 17 high priority chemicals by 33% at end of 1992 and by 50% at the end of 1995. • It encouraged firms to use less toxic substitutes and to reformulate products. • Encouraged firms to redesign production processes to achieve source reduction, rather than resort to end-of-pipe clean-up. Source: Journal of Environmental Economics and Management 28, 271 -286 (1995)
Overview of the 33/50 Program • 33/50 focused on 17 chemicals because • The Chemicals selected for 33/50 program accounted for one-quarter of releases produced by industry • Toxicity • Volume in which they are produced by industry • Pollution prevention mechanisms exist for these chemicals
Benzene Carbon tetrachloride Chloroform Dichloromethane Methyl ethyl ketone Methyl isobutyl ketone Cadmium and cadmium compounds Chromium and chromium compounds Cyanide compounds Lead and lead compounds [Source: EPA-745-R-99-004] Mercury and mercury compounds Nickel and nickel compounds Tetrachloroethylene Toluene 1,1,1-Trichloroethane Trichloroethylene Xylenes Chemicals Targeted by 33/50 Program
Overview of the 33/50 Program • 33/50 was a unique regulatory experiment which: • Stressed cooperation between regulators and industry • Was non-adversarial • Provided positive feedback to participants • Awarded participating firms • Participants’ commitments to achieve pollution prevention goals were not enforceable by law; thus firms could renege on their commitment. Source: Journal of Environmental Economics and Management 28, 271 -286 (1995)
Overview of the 33/50 Program • Incentives offered by the program include: • Public recognition by EPA(newsletters, PSA, trade journal articles) • Awards for innovators and firms with outstanding pollution prevention achievements • Flexibility to undertake the most cost-effective emission reductions • Firms benefit form Pollution Prevention Information Exchange System (PIES) - technical information is available to both participating and non-participating firms
33/50 and EPA’s Enforcement Duty Caveat • The voluntary nature of the program meant that a company’s decision to participate did not change its responsibilities for complying with all other laws and regulations. • Participation in the program was enforcement neutral • a company would receive no special scrutiny if it elected not to participate • received no relief from normal enforcement attention if it did elect to participate. Source: USEPA Reducing Risks Through Voluntary Action. Aurora and Carson
Company Participation • EPA Outreach • Focused on facilities reporting to TRI on any of the 17 targeted chemicals from 1988 - 1994. This pool of Companies numbered almost 20,000. • Initial communications were to CEO or parent companies. • EPA Invited 5,000 companies to participate in 1991. • Subsequently invited 2,500 more over next three years. • Targeted outreach to the 600 companies with greatest amount of releases and transfers to the environment. 33/50 Program: The Final record [Source: EPA-745-R-99-004]
Company Participation • Approximately 1,300 signed agreements to participate (13% of all those targeted) • These 1,300 companies were responsible for 60% of releases and transfers of the 17 TRI chemicals targeted by 33/50. • 1,066 companies set measurable goals for reducing their releases and transfers of the 17 targeted chemicals against the 1988 baselines. • These pledges totaled 370 million pounds, representing a little less than 1/2 of their total 1988 release and transfers of 778 million pounds.
Flexibility in Goal Setting • Other companies developed goals: • Tied to changes in their production levels • By choosing alternative baseline years • By setting reduction goals for all of their TRI reporting without specific goals for the 33/50 chemicals. • Choose pollution prevention to reduce their targeted chemicals. • As a result: • 370 million pounds of pledged reductions represent a lower bound that companies attempted under 33/50 program. 33/50 Program: The Final record[Source: EPA-745-R-99-004]
EPA Program Evaluation33/50 Program • Data is presented for three time periods • 1988 - 1990 : Captures information before program began • 1990 - 1995 : Measures progress during program tenure • 1995 -1996 : tracks development in first year after program ended Source: http://www.epa.gov/opptintr/3350/33finb1.htm
33/50 Program Results General Results: • Pre-33/50 • 1988 - 1990: Releases and transfers of 33/50 program chemicals decreased by 16% while releases and transfers of non-33/50 chemicals decreased by 24%. • During 33/50 • 1990 - 1991: Releases and transfers of 33/50 chemicals decreased by 21%, while the releases and transfers of all TRI chemicals fell by 8 %. • One year after 33/50, reduction trend continues Source: Journal of Environmental Economics and Management 28, 271 -286 (1995)
33/50 Program Results [Source: EPA-745-R-99-004]
33/50 Program: Key Findings • The program achieved its goal in 1994, one year ahead of schedule • Largest reductions in 33/50 Program chemical emissions were driven by U.S. action to phase out ozone-depleting chemicals under the Montreal Protocol. • Facilities also reduced releases and transfers of the other 33/50 chemicals (excluding ozone depleters) by 50% from 1988 to 1995. • There is some indication that there have been shifts toward on-site treatment and releases to land and water away from air. [Source: EPA-745-R-99-004]
33/50 Program: Key Findings • Facilities reported more source reduction activity for 33/50 chemicals than for other TRI chemicals. • Activity covered a greater percentage of production-related waste for 33/50 chemicals than for other TRI chemicals. • Reductions continued at a higher rate for 33/50 chemicals than for other TRI chemicals in the year after the 33/50 Program ended
Methods Used to Meet P2 Goals • Materials substitution is a very common method to reduce wastes and emissions • Olin has eliminated use of 1,1,1 trichloroethane (TCA) and dichloromethane used as degreasers by using an alkaline and hot water rinsing system. • DuPont is now using high pressure water for cleaning equipment in its fluroelastomer production facility.
Methods Used to Meet P2 Goals • Recycling has become a frequently used means for managing waste • Allied signal installed a sulfuric acid purification system and reduced waste by 250,000 lb/yr. • American Cyanamid designed a facility to recover sulfuric acid and other chemicals that they previously disposed of through deep-well injection.
Another Look at Results • Of total reduction in releases of these 17 chemicals during 1988 - 1993, 40 % took place between 1988 and 1990 - before the program started. • Between 1991 and 1993 releases by participants fell by 41% and non-participants by 18%. • It is inappropriate to attribute all the reductions that occurred since 1991 to the 33/50 Program, according to the GAO, because some was achieved by non-participants. • Toxic Watch reports that 31 % of participants had achieved some reduction in release before 33/50 program. Firms that had already demonstrated reductions relative to 1988 baseline would be more likely to join. Source: EPA’s 33/5- Program: Impact on Toxic Releases and Economic Performance of Firms Khanna/Damon
Overview of the 33/50 Program Conclusion • Companies emitting largest amounts of toxic releases are most likely to take part in the program. • Voluntary programs may work because they target the companies with the greatest reduction potential. • Public awareness plays a key role and can increase participation by encouraging competition in environmental quality. • EPA should provide substantial public recognition and awards to firms achieving real reductions. Source: Journal of Environmental Economics and Management 28, 271 -286 (1995)