Download
1 / 26
260 likes | 414 Vues
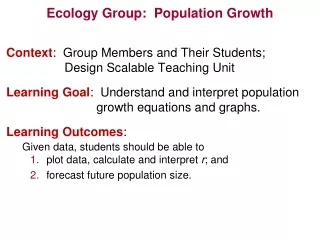
Participants Bryan Darby Christopher Felege Krista Fritz Steven Kelsch Lisa Kenyon Lindsey Tuominen Mary Williams. Ecology Group. Facilitators Catherine Kirkpatrick Rob Brooker. 2012 NANSI Minneapolis, Minnesota. Ecology Group. Learning Goal:

E N D
Participants Bryan Darby Christopher Felege Krista Fritz Steven Kelsch Lisa Kenyon Lindsey Tuominen Mary Williams Ecology Group Facilitators Catherine Kirkpatrick Rob Brooker 2012 NANSI Minneapolis, Minnesota
Ecology Group Learning Goal: • Understanding human population growth and its environmental impacts • Context: • Target: Biology Majors or Non-Majors • One semester Introductory Biology Course • Active Learning Classroom (where students are experienced with these types of activities)
Ecology Group Learning Goal: • Understanding human population growth and its environmental impacts Context: • Near the end of the semester – Ecology Unit • Already covered in class: concepts like abiotic and biotic interactions, community ecology, diversity, nutrient cycling and energy flow
Ecology Group Learning Goal: • Understanding human population growth and its environmental impacts Learning Outcomes: 1. Identify historical and recent trends in human population growth and describe causes of this growth, 2. Explain how human population size relates to global environmental issues, 3. Based on explanations from OC2, synthesize human impacts via diagrammatic model, and use that model to predict environmental outcomes, 4. Based on a provided rubric, peer evaluate diagrammatic models for strengths and weaknesses of synthesis.
Ecology Group Learning Outcome 1 • Identify historical and recent trends in human population size and describe causes of this growth. • Summative assessment: Multiple Choice Exam questions that test identification of population growth trends, description, and causes. • Activity: Graph 1) prediction, and 2) actual data of historical trends.
Ecology Group Group Roles Left: Manager (keep track of time and task objectives, and participation) Middle: Recorder(run computer and write group responses) Right: Skeptic/Reporter (challenge group conclusions when necessary, report results to table).
Ecology Group Can the human population continue to grow? Link to world population clock here
Ecology Group • Why the depression around 1400? • Why does the human population seem to increase so rapidly around the 1800's and 1900's?
Ecology Group Human population map
Ecology Group Carbon emissions map
Ecology Group Land use map
Ecology Group Global Urbanization Map
Ecology Group Learning Outcome 2 • Describehow human population size relates to global environmental problems/processes • Summative Assessment: Choosing the most appropriate explanation from a set of options describing the relationship between a given problem/process and human population size • Activity: Individually define terms on cards, then write one sentence describing relationship to human population size
Ecology Group How does human population size relate to global environmental problems? • STEP 1:Your tables are dividedinto 3 subgroups • Each subgroup gets a set of cards • STEP 2: After you get your cards… • Remove the “human population” card • Each individual should select two cards • to work on
Ecology Group How does human population size relate to global environmental problems? • STEP 3:Write a separate definition on each card for the term written on it. Individual work (2 min) • STEP 4:On each card, write one sentence describing the connection between the term and human population size. Individual work (2min) • STEP 5: Share, critique, clarify definitions & “connection” sentences within the group (6 min)
Ecology Group Learning Outcome 3 • Outcome 3:Based on the explanations developed in OC 2, synthesize human impacts into a diagrammatic model. • Summative Assessment: Construct a model that explains relationships among different individual factors within the 3 categories(Carbon, Urbanization, and Agriculture) that are affected by human population that are to be used to predict environmental outcomes.
Activity: Your job now is to build a model with your group of 3 at the white boards based on one of the following 3 categories: CarbonAgricultureUrbanization Human Population Human Population Human Population Fossil Fuel Combustion Photosynthesis Housing Oceans Food Supply Deforestation Atmospheric CO2 Water Erosion Climate Change Erosion Biodiversity Carbon Sequestering Nitrogen Runoff Oceans Photosynthesis Cattle Lot Pollution Use a black marker to construct the arrows and linking terms to explain connections related to Human Populations Remember to consider your audience: This will be evaluated by your peers - FOCUS ON ACCURACY AND CLARITY FOR OTHERS TO UNDERSTAND!!! 8 Minutes
Ecology Group At this point Each group have their reporter take 2 minutes to explain their model (Carbon, Agriculture, and Urbanization) to the 9 person group as a whole. This provides an opportunity for peer edits, review, and "tweaking" as needed First Group - 1 minute for explaining, 1 minute for feedback Second Group - 1 minute for explaining, 1 minute for feedback Third Group - 1 minute for explaining, 1 minute for feedback
Ecology Group Understanding human population growth and its environmental impacts Carbon Human Population Agriculture Urbanization
Ecology Group The Ultimate Model Challenge As a table team, construct a synthesis model showing all three models and their linkage to Human Population(5 minutes) Using colored markers include arrows and linking terms to explain these connections Consider your audience. This will be evaluated by your whole class peers--check model for accuracy and clarity for others to understand.
Summative assessment OC3 – one paper per 3 1. If the human population continues to grow at approximately its current rate, what effect would that have on your overall Carbon, Agriculture, OR Urbanization model and WHY (select one of the three). 2. If science found a way to increase global photosynthesis levels, what effects would you predict that to have on global climate change and WHY? 3. If the human population continues to grow at approximately the current rate, what other impacts do you think might occur to the environment, and how might you model this?
Ecology Group Learning Outcome 4 • You Decide! Peerevaluation of synthesis models. • Assessment: Peer evaluation of another group's model for strength and weakness with suggestions for improvement based on a rubric. • Summative assessment will be instructor grading of the revised final version of the model
Rubric for evaluating models Your Name_________________________________ Your Group Number Group Number Being Evaluated Goal Understand human population growth and its environmental impacts Outcomes 2 through 4. Students will demonstrate that they are able to accurately synthesize the major impacts of the human population on aspects of the global environment: Model strengths Suggestions for Improvement
Judging the Ultimate Model • When your table's model is complete, each student will be given a rubric to be used to evaluate the model prepared by another group. • When instructed, your whole table will move clockwise to the whiteboard model of neighboring group. • Each student will independently evaluate the model using the rubric. • Look over the model paying attention to the following: • How the model is put together, in other words, its synthesis. • Are all terms within each color connected by arrows in an order that makes sense? • Are the submodels of each color connected to the Human Population and to the other color submodels in a way that makes sense? • Note that there are different correct ways that the model can be constructed so it doesn't have to be exactly like yours. • Use the rubric to provide feedback about the model to the other group by noting strengths and circling words on the rubric that describe weaknesses if any. • Taking into account strengths and weaknesses that you have observed, assign your score for the model by circling a number (5best to 0 worst). Be sure to give your honest judgment. • Add notes on the bottom of the rubric page on what you think is good (strengths) about the model and what you think could be changed to help the group improve their final model. • When instructed, collect your group’s completed rubric forms and return them to the group you evaluated.
The Judges have spoken • Work with your whole table to revise your Ultimate Model using the feedback you have received from your neighboring group. Note that the individual evaluations may not agree so do your best to make changes according to the majority of judges. If you do not agree with the feedback, consider that clarifying your model may be all that is needed. • When you have used the feedback from the judges to create a final version of your model, use a computer or phone to take a clear digital image of your model. • Be sure that one member of your group submit the image of your model to the instructor for grading. The instructor will use the same rubric for assigning your group’s grade. • Also, collect the rubrics that you received from your neighbor group and turn them into the instructor by the end of the class period.