Download
1 / 15
150 likes | 215 Vues
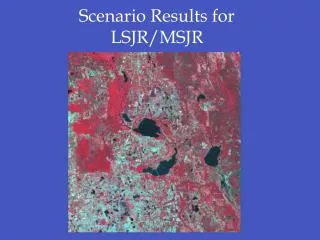
System Performance Results for Scenario 1. Santosh Abraham, Arnaud Meylan, Sanjiv Nanda Qualcomm, Inc. snanda@qualcomm.com. Simulation Methodology. The simulator is based on ns2 Includes physical layer features TGn Channel Models PHY Abstraction determines frame loss events MAC features

E N D
System Performance Results for Scenario 1 Santosh Abraham, Arnaud Meylan, Sanjiv Nanda Qualcomm, Inc. snanda@qualcomm.com
Simulation Methodology • The simulator is based on ns2 • Includes physical layer features • TGn Channel Models • PHY Abstraction determines frame loss events • MAC features • EDCA • Adaptive Coordination Function (ACF): SCHED and SCAP • Frame Aggregation • ARQ with Block Ack • Closed Loop Rate Control (DRVF and DRV) • MIMO Modes (ES and SS) • Transport • File Transfer mapped to TCP • QoS Flows mapped to UDP
Statistics Obtained • Throughput: • As defined in CC 20. Throughput Metric 2. • For each flow denote • tl: Time at which the last packet is transferred to the receiver LLC • tf: Time at which the first packet arrives at the sender MAC SAP • N: Number of packets delivered within the delay bound to the receiver LLC by tl • p: Packet size. Flow Throughput = • Mean Delay: • Mean of the time taken from packet arrival at the sender to packet arrival at the receiver across all packets of the flow.
Statistics Obtained • Packet Loss Rate: • As defined in CC 19 • Number of MSDUs that are not delivered at the Rx MAC SAP within the specified delay bound, divided by the total number of MSDUs offered at the Tx MAC SAP • Reasons for a packet being dropped are: • Delay incurred by the packet exceeds the delay tolerance of the flow. Delay is inclusive of scheduling and retransmission attempts. • Packet has not been delivered after a maximum number of transmission attempts.
Statistics Obtained • Mean PHY Rate: • As defined in CC 27: • N: Number of packets transmitted. • ri: PHY Transmission rate of ithpacket. • ti: Transmission time of the ith packet Mean PHY Rate =
Simulation Scenarios • Modified TGn Usage Models Scenario 1 • Channel Model B • Scenario 1 HT (High Throughput) • Increased Offered Non-QoS Load. • Additional 25 Mbps Internet file transfer at 15.5 m for 2x2 • Additional 100 Mbps Internet file transfer at 15.5 m for 4x4 • Scenario 1 LD (Low Delay) • Increased Offered Non-QoS Load. • Reduce all multimedia application delays to 50 ms. • Scenario 1 IR (Increased Range) • Increased Offered Non-QoS Load. • Reduce all multimedia application delays to 50 ms. • HDTV receivers moved to 25 m (instead of 5 m)
Simulation Conditions • Simulation Parameters Alternate values considered in italics • ACF and EDCA • Frame Aggregation • Block ACK (Delayed ACK) • Highest MCS: 7 bits/symbol. Also considered 5 bits/symbol • All links: 2x2. Also considered 4x4. • 5.25 GHz • EDCA Parameters
Performance Metrics • Per flow • Throughput • Packet loss rate (PLR) • Mean delay • Time-averaged PHY data rate • Per scenario • Total throughput, • Latency of QoS flows, • Throughput for non-QoS flows • MAC Efficiency
Scenario 1 HT (High Throughput) Scenario 1 LD (Low delay) Scenario 1 IR (Increased Range)
Scenario 1 IR 2x2 Scenario 1 IR 4x4
Scenario 1 HT Maximum 5 bits/symbol Scenario 1 LD Maximum 5 bits/symbol Scenario 1 IR Maximum 5 bits/symbol
Conclusions from Scenario 1 Study • TGn Usage Models Scenario 1 requirements can be met and exceeded with 2x2. • Using Scheduled operation: • MAC Efficiency is in the range 74%-78%. • Scenario 1 HT: Throughput can be increased to above 100 Mbps • Scenario 1 LD: Video stream latency can be reduced below 50 ms (from 200 ms). Total throughput: 103 Mbps • Scenario 1 IR: Range of HDTV flows can be increased from 5 m to 25 m. Total throughput: 92 Mbps • MAC Efficiency of EDCA with Frame Aggregation is around 56% for 2x2 and falls to 35% for 4x4. • Throughput with 256 QAM • ~15% throughput improvement with 256 QAM • By setting Maximum MCS=5 bits/symbol obtain 80-92 Mbps for IR, LD, HT.