Download
1 / 10
610 likes | 2.11k Vues
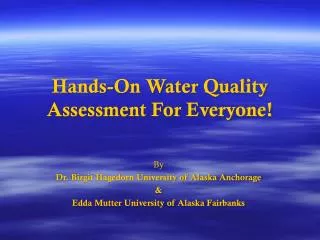
Water Quality Assessment I. Upstream and Downstream Influences. Introduction. Not limited to drinking water. Determine the overall health of any aquatic environment. Can be done in two ways: Simple observation Using highly sensitive equipment :

E N D
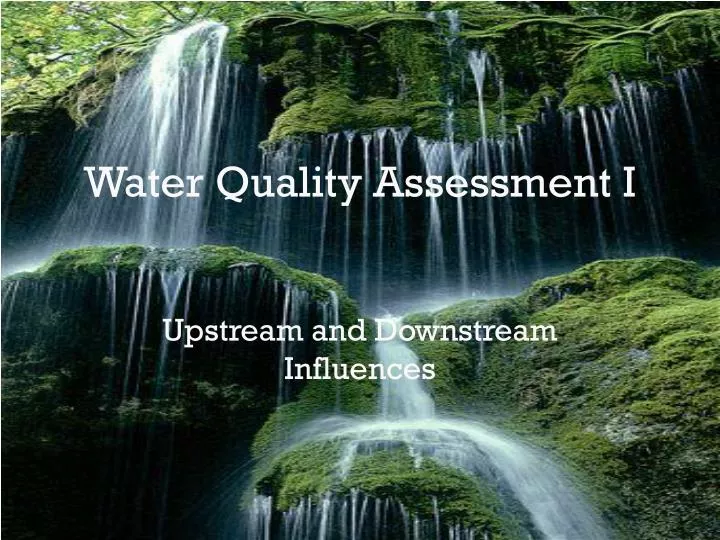
Water Quality Assessment I Upstream and Downstream Influences
Introduction • Not limited to drinking water. • Determine the overall health of any aquatic environment. • Can be done in two ways: • Simple observation • Using highly sensitive equipment : Conductivity meter, dissolved oxygen meter, pH meter, etc.
Litter, industrial waste Agricultural run-off, acid rain, airborne pollutants Sources of Pollution Direct Indirect
Objectives • Become familiar with the techniques and equipment used to analyze water quality. • To understand and interpret what the results of our analysis tells us by building a graph
Measuring Water Quality • Temperature • Affects the ability of water to hold oxygen and organisms to resist pollutants • Dissolved Oxygen (DO) • Volume of oxygen contained in water • Units are mg/L and % saturation • DO>5 mg/L = favorable to most organisms • DO<3 mg/L = Stressful to most organisms • DO, 2 mg/L = Does not support fish • DO concentrations result from equilibrium between oxygen production and consumption • The amount of DO that can be held by water depends on salinity, water temperature and atmospheric pressure • Organisms have a required amount of DO to live optimally • How does temperature, salinity and pressure affect DO?
Conductivity (µS/cm) • Measures dissolved minerals in the water • Pure water = 0.055 µS/cm • Distilled water = 0.5 µS/cm • Natural streams = 1.0 µS/cm • Sea water = 50,000 • Metals are pollutants • Cause mutations, reproductive failure and death • pH (no units) • Potential of hydrogen • pH is a measure of the acidity or alkalinity in the water (H+) • Between 0 (acidic) and 14 (basic) • A pH of is 7 neutral • pH 6 = crustaceans, insects and plankton start to disappear • pH 5 = loss of fish populations, undesirable plankton and mosses appear • pH < 5.0 = water devoid of fish, organic material does not decompose properly, shorelines dominated by mosses
Optical Density (OD) • Measurement of the amount of light a sample absorbs at a given wavelenght • Directly proportional to the concentration in the sample • We will measure amount of light absorbed by a plankton sample • High OD means high plankton density • Instrument used is the spectrophotometer
Procedure Fill in table 12.1 (pg. 100) and worksheet (pg. 103) • Water samples from two sources. • Water measurements include: • Temperature, dissolved oxygen, conductivity, pH and optical density • Label sample containers with: • Upstream or • Downstream
Next Lab • Eutrophication assignment and set up • Attendance is mandatory for credit • Graphing assignment due (5pts)