Download
1 / 23
360 likes | 977 Vues
NWEA MAP . Palmer Parent/Guardian Presentation. High Stakes. School accountability Teacher accountability Principal accountability. Agenda. What is NWEA MAP? Accessing Reports and Results. What is NWEA MAP?. PARENT TRAINING. What is NWEA MAP?. NWEA = NorthWest Evaluation Association

E N D
NWEA MAP Palmer Parent/Guardian Presentation
High Stakes • School accountability • Teacher accountability • Principal accountability
Agenda • What is NWEA MAP? • Accessing Reports and Results
What is NWEA MAP? PARENTTRAINING
What is NWEA MAP? • NWEA = NorthWest Evaluation Association • Assessments • MAP = Measures of Academic Progress (Grades 2-8) • Subjects • Math, Reading (Grades 2-8) • Seasons (MAP) • Winter (OPTIONAL) • Spring (Required)
Advantages of MAP/MPG • Adaptive Assessments • Questions adapt to each individual student (right/wrong answer determines difficulty of question) • Improves precision of results AND growth measurements • All students are virtually guaranteed to get 50% right
Advantages of MAP • Single Scale of Measurement • Learning is a “highway” • RIT Scores are “mile-markers” • Any student in any grade can theoretically get any RIT score • No more ceiling/floor effects
Advantages of MAP • Alignment • MAP is aligned to state standards and to common core • Focuses on “What’s Next” • Based on the continuum of learning associated with the scale of measurement • Provides views on specific sets of skills individual students are likely to have just learned, what they should learn next, and what they can be introduced to
Advantages of MAP • Reporting & Analytics • Online testing and reporting system means instant results • Statistical alignment to ISAT = student predictions for proficiency • Grade-level national norms provide context for “at grade level” • Multiple attempts each year provide growth during the year • Collaboration & Resources • Widely used in IL (i.e. minimize “re-inventing the wheel”) • NWEA has been around since 1980’s, providing access to tons of resources for using and analyzing results • Professional development available at a cost
Overview – Teachers use these • Getting Started • RIT Scale • Des Cartes / Goal Areas • Reports • Confidentiality • Start “small” • Focus on personal understanding and building capacity • TALK to your peers about results • TALK to families (at conferences) about results • Class breakdown report
RIT Scale • RIT = Rasch Unit • “Learning Highway” • Aligned with skills students are learning from K to 12 • A “RIT Range” is 10 points, each represents a “mile marker” related to students arriving at a new set of skills to be learned • The higher the RIT score, the harder the content • Goal area / strand scores are only reported as RIT bands • Check out the RIT Reference charts at: http://www.nwea.org/support/article/1140
Des Cartes • The skills students should be learning at each RIT band (for MAP, this is aligned with IL Standards and now with Common Core) • When “centered” on a student’s RIT score/band… • The band to the left represents skills the student is close to mastering • The band to the right represents skills the student can be introduced to • The band in the middle is what to focus on next
Reports • Class breakdown report is one of the most useful reports in the NWEA system • Presents student performance by class and subject, with options to drill down into subjects (goal areas) or to examine predicted proficiency on the MCA • This is also connected to Des Cartes, so, for a group of students and a specific goal area, you can look at skills those students are likely to be successful in learning next
Reports • While useful, reports in MAP are what all other reports are… just a representation of the student’s performance on a test • How well this reflects reality depends on a number of factors, but when it is a good reflection, it can be very useful information • Make sure to interpret the results in the context of other information (i.e. if they don’t feel right, investigate why) • Also, don’t use results in a vacuum… • Seek out the perspectives of your peers and give them yours • Talk over the results with families at conferences • Most importantly…DON’T IGNORE THE RESULTS! These results are intended to give you information which can help you improve instruction for students.
Conferences • Student progress and goal setting PDFs have been provided to you • Teachers will reviewthese with students and parents, discussing: • Overall score related to district and national grade-level norms • Areas of strength and weakness (use RIT Reference charts to emphasize the kinds of questions the student is ready to learn, as well as what’s expected grade-level, given the grade-level average RIT) • Growth goals for the year
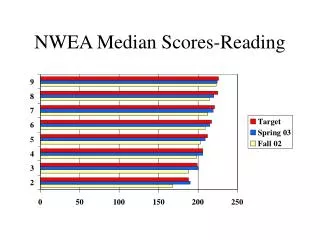
Norm/Avg. for Fall G3 Math (192.1)
Thank You!!! Questions?