Download
1 / 1
10 likes | 132 Vues
UCI University of California, Irvine. B23A-0948.

E N D
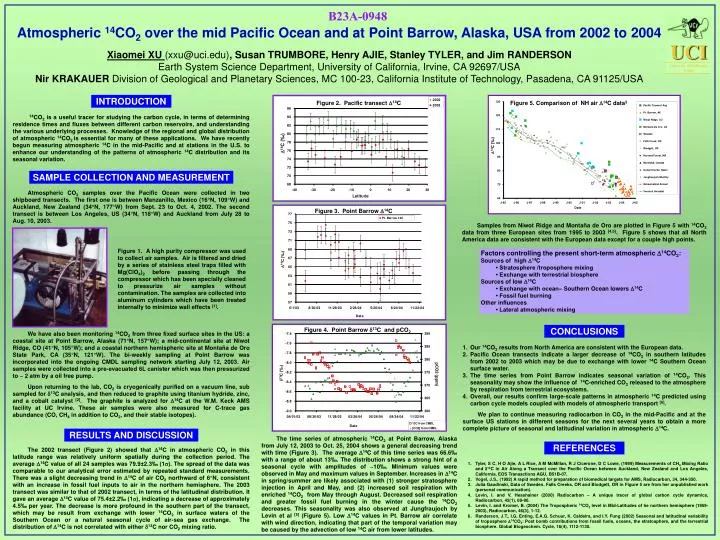
UCI University of California, Irvine B23A-0948 Atmospheric 14CO2 over the mid Pacific Ocean and at Point Barrow, Alaska, USA from 2002 to 2004Xiaomei XU (xxu@uci.edu), Susan TRUMBORE, Henry AJIE, Stanley TYLER, and Jim RANDERSONEarth System Science Department, University of California, Irvine, CA 92697/USANir KRAKAUER Division of Geological and Planetary Sciences, MC 100-23, California Institute of Technology, Pasadena, CA 91125/USA INTRODUCTION Figure 2. Pacific transect D14C Figure 5. Comparison of NH air D14C data3 14CO2 is a useful tracer for studying the carbon cycle, in terms of determining residence times and fluxes between different carbon reservoirs, and understanding the various underlying processes. Knowledge of the regional and global distribution of atmospheric 14CO2 is essential for many of these applications. We have recently begun measuring atmospheric 14C in the mid-Pacific and at stations in the U.S. to enhance our understanding of the patterns of atmospheric 14C distribution and its seasonal variation. D14C (‰) D14C (‰) SAMPLE COLLECTION AND MEASUREMENT Atmospheric CO2 samples over the Pacific Ocean were collected in two shipboard transects. The first one is between Manzanillo, Mexico (16°N, 109°W) and Auckland,New Zealand (34°N, 177°W) from Sept. 23 to Oct. 4, 2002. The second transect is between Los Angeles, US (34°N, 118°W) and Auckland from July 28 to Aug. 10, 2003. Figure 3. Point Barrow D14C Samples from Niwot Ridge and Montaña de Oro are plotted in Figure 5 with 14CO2 data from three European sites from 1995 to 2003 [4,5]. Figure 5 shows that all North America data are consistent with the European data except for a couple high points. Figure 1. A high purity compressor was used to collect air samples. Air is filtered and dried by a series of stainless steel traps filled with Mg(ClO4)2 before passing through the compressor which has been specially cleaned to pressurize air samples without contamination. The samples are collected into aluminum cylinders which have been treated internally to minimize wall effects [1]. Factors controlling the present short-term atmospheric D14CO2: Sources of high D14C • Stratosphere /troposphere mixing • Exchange with terrestrial biosphere Sources of low D14C • Exchange with ocean– Southern Ocean lowers D14C • Fossil fuel burning Other influences • Lateral atmospheric mixing D14C (‰) CONCLUSIONS Figure 4. Point Barrow d13C and pCO2 We have also been monitoring 14CO2 from three fixed surface sites in the US:a coastal site at Point Barrow, Alaska (71°N, 157°W); a mid-continental site at Niwot Ridge, CO (41°N, 105°W); and a coastal northern hemispheric site at Montaña de Oro State Park,CA (35°N, 121°W). The bi-weekly sampling at Point Barrow was incorporated into the ongoing CMDL sampling network starting July 12, 2003. Air samples were collected into a pre-evacuated 6L canister which was then pressurized to ~ 2 atm by a oil free pump. Our 14CO2 results from North America are consistent with the European data. Pacific Ocean transects indicate a larger decrease of 14CO2 in southern latitudes from 2002 to 2003 which may be due to exchange with lower 14C Southern Ocean surface water. The time series from Point Barrow indicates seasonal variation of 14CO2. This seasonality may show the influence of 14C-enriched CO2 released to the atmosphere by respiration from terrestrial ecosystems. Overall, our results confirm large-scale patterns in atmospheric 14C predicted using carbon cycle models coupled with models of atmospheric transport [6]. 13C (‰) pCO2 (ppm) Upon returning to the lab, CO2 is cryogenically purified on a vacuum line, sub sampled for d13C analysis, and then reduced to graphite using titanium hydride, zinc, and a cobalt catalyst [2]. The graphite is analyzed for 14C at the W.M. Keck AMS facility at UC Irvine. These air samples were also measured for C-trace gas abundance (CO, CH4 in addition to CO2, and their stable isotopes). We plan to continue measuring radiocarbon in CO2 in the mid-Pacific and at the surface US stations in different seasons for the next several years to obtain a more complete picture of seasonal and latitudinal variation in atmospheric D14C. RESULTS AND DISCUSSION The time series of atmospheric 14CO2 at Point Barrow, Alaska from July 12, 2003 to Oct. 25, 2004 shows a general decreasing trend with time (Figure 3). The average D14C of this time series was 66.6‰ with a range of about 13‰. The distribution shows a strong hint of a seasonal cycle with amplitudes of ~10‰. Minimum values were observed in May and maximum values in September. Increases in D14C in spring/summer are likely associated with (1) stronger stratosphere injection in April and May, and (2) increased soil respiration with enriched 14CO2 from May through August. Decreased soil respiration and greater fossil fuel burning in the winter cause the 14CO2 decreases. This seasonality was also observed at Jungfraujoch by Levin et al [5] (Figure 5). Low D14C values in Pt. Barrow air correlate with wind direction, indicating that part of the temporal variation may be caused by the advection of low 14C air from lower latitudes. REFERENCES The 2002 transect (Figure 2) showed that D14C in atmospheric CO2 in this latitude range was relatively uniform spatially during the collection period. The average D14C value of all 24 samples was 79.9±2.3‰ (1s). The spread of the data was comparable to our analytical error estimated by repeated standard measurements. There was a slight decreasing trend in D14C of air CO2 northward of 6°N, consistent with an increase in fossil fuel inputs to air in the northern hemisphere. The 2003 transect was similar to that of 2002 transect, in terms of the latitudinal distribution. It gave an average D14C value of 75.4±2.2‰ (1s), indicating a decrease of approximately 4.5‰ per year. The decrease is more profound in the southern part of the transect, which may be result from exchange with lower 14CO2 in surface waters of the Southern Ocean or a natural seasonal cycle of air-sea gas exchange. The distribution of D14C is not correlated with either d13C nor CO2 mixing ratio. • Tyler, S C, H O Ajie, A L Rice, A M McMillan, R J Cicerone, D C Lowe, (1999) Measurements of CH4 Mixing Ratio and 13C in Air Along a Transect over the Pacific Ocean between Auckland, New Zealand and Los Angeles, California, EOS Transactions AGU, B51B-07. • Vogel, J.S., (1992) A rapid method for preparation of biomedical targets for AMS, Radiocarbon, 34, 344-350. • Julia Gaudinski, Data of Sweden, Falls Creeks, OR and Blodgett, OR in Figure 5 are from her unpublished work (personal communication). • Levin, I. and V. Hesshainer (2000) Radiocarbon – A unique tracer of global carbon cycle dynamics, Radiocarbon, 42(1), 69-80. • Levin, I. and Kromer, B. (2004) The Tropospheric 14CO2 level in Mid-Latitudes of he northern hemisphere (1959-2003), Radiocarbon, 46(3), 1-12. • Randerson, J.T., I.G. Enting, E.A.G. Schuur, K. Caldeira, and I.Y. Fung (2002) Seasonal and latitudinal variability of troposphere 14CO2: Post bomb contributions from fossil fuels, oceans, the stratosphere, and the terrestrial biosphere. Global Biogeochem. Cycle, 16(4), 1112-1130.