Download

1 / 16
160 likes | 387 Vues
Crosstabs. Types of relationships. Linear Spurious Intervening Interaction effects Suppression. Linear effects. Theory: National pride (alienation). When people feel alienated from the political system, then they may be more likely to participate in politics.

E N D
Types of relationships • Linear • Spurious • Intervening • Interaction effects • Suppression
Theory: National pride (alienation) • When people feel alienated from the political system, then they may be more likely to participate in politics. • When people feel national pride in the political system, then they may be less likely to participate in politics. • Measure: • How often do you feel ashamed of Russia? very often, rather often, not very often, hardly ever
Dependent variable: political participation • People either participate or they do not. • There are 31 questions about different political activities. • How should this variable be measured?
Measure of political participation freq vars = polpartbes2.
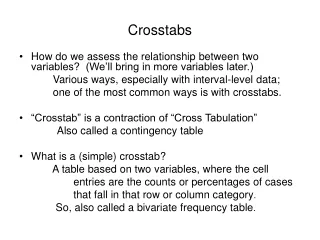
Crosstabs analysis • Like a frequency table, it reports how many and what percentage fall into a particular category, but for two variables instead of one • Not suitable for continuous variables; only for discretely measured variables • It is sometimes useful to recode a variable with too many categories FOR THE PURPOSES OF ILLUSTRATION ONLY
Conventions • the independent variable is arranged across the top of the table • Percentages should be calculated using COLUMN • Syntax: crosstabs tables DV by IV /cells = coll.
Creating collapsed variables • compute polpartbesc = polpartbes. • if polpartbes > 1 polpartbesc = 2.
Syntax: missing and crosstabs • Some useful syntax: • missing values ashamerus (7,8,9). • crosstabs tables = polpartbesc by ashamerus/cells = col/stats = corr.
Syntax for scatter plot GRAPH /SCATTERPLOT(BIVAR)=ashamerus WITH polpartbes /MISSING=LISTWISE. Notice that there is no need for extra categorization – so we used polpartbes, not polpartbesc.