Download

1 / 65
650 likes | 660 Vues
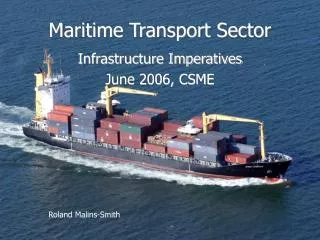
Carbon Management in the Maritime Sector. A LECTURE BY IAN WILLIAMS. Contents. Maritime Industry overview Fuel Emissions Governance Controls Measuring carbon emissions Overview. The Maritime Industry. 90% of world trade is carried by sea Essential to global infrastructure

E N D
Carbon Management in the Maritime Sector A LECTURE BY IAN WILLIAMS
Contents • Maritime Industry overview • Fuel • Emissions • Governance • Controls • Measuring carbon emissions • Overview
The Maritime Industry • 90% of world trade is carried by sea • Essential to global infrastructure • Over 100,000 vessels over 100GT currently registered with Lloyds Register • Liner Shipping industry contributed $183.3 billion to the global economy in 2007 (World Shipping Council, 2009)
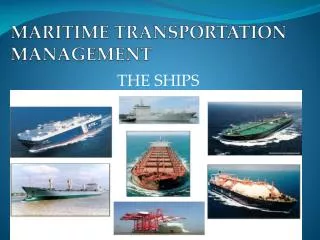
Maritime Activities • Shipping • Passenger Craft • Sport and Leisure • Fishing • Research • Services • Oil and Gas Extraction • Electricity Generation • Ports • Waste Management
Vessels • December 2010: world fleet of propelled sea-going merchant ships (>=100 GT) comprises 104,304 ships • 1,043,081,509 million GT • average age of 22 years • Fleet registered in >150 nations • Manned by 1.5 million seafarers • World‘s cargo carrying fleet (2011) is 55,138 ships • 991,173,697 GT • average age of 19 years
Flags by Country – Merchant fleets Figures in brackets are in gross tonnes of shipping registered in the countries and territories listed. (Data based on IHS Fairplay “World Fleet Statistics 2010” data as at 31 December 2010). 1. Panama (201,264,453) 2. Liberia (106,708,344) 3. Marshall Islands (62,011,182) 4. Hong Kong, China (55,543,246) 5. Bahamas (50,369,836) 6. Singapore (44,869,918) 7. Greece (40,795,358) 8. Malta (38,737,657) 9. China (34,705,141) 10. Cyprus (20,732,488) 11. Italy (17,044,319) 12. Japan (16,857,860) 13. United Kingdom (16,477,909) 14. Germany (15,282,545) 15. Norway NIS (13,828,168) 16. Republic of Korea (12,512,549) 17. United States (11,941,087) 19. Isle of Man (11,620,778) 18. Denmark DIS (11,530,364) 20. Antigua and Barbuda (10,737,659)
Fuel • 95% of current world fleet are diesel engines • 50% of running costs attributable to fuel • Ships can run on low cost, low grade residual fuels, however these have a number of environmental implications
Scale Source: Wartsila 2013
Emissions Source: Second IMO GHG Study, 2009
GHG Regulation According to the Kyoto Protocol: “The Parties included in Annex I shall pursue limitation or reduction of emissions of Greenhouse Gases not controlled by the Montreal Protocol from Aviation and Marine Bunker fuels, working through the International Civil Aviation Organisation (ICAO) and the International Maritime Organisation respectively”
Governing body The International Maritime Organisation (IMO) The inter-governmental organisation responsible for safety, environmental concerns, legal matters, technical co-operation, maritime security and the efficiency of shipping.
Governing body IMO established in 1948 as a means of improving safety at sea via international regulations The Marine Environment Protection Committee (MEPC): body working within IMO conducts 9-monthly meetings to discuss regulation of all environmental concerns within international shipping
MARPOL • ‘The United Nations Convention on the Prevention of Pollution from Ships’ • Abbreviated to MARINE POLLUTION (MARPOL 76/78/97) • Annex VI “Prevention of Air Pollution from Ships”
Legislation • Controls on NOx • Engine requirements: Engine International Air Pollution Prevention (EIAPP) certificate • Controls on SOx • Maximum sulphur content of bunker fuel at 3.5% (1% in emissions control area)
Energy Efficiency Design Index (EEDI) Ensures new ships meet the minimum level of energy efficiency expressed in gCO2 per unit of transport work: Provides a normalised value of CO2 emissions per tonne/nautical mile.
The Ship Energy Efficiency Management Plan (SEEMP) Takes into account operational measures to reduce fuel consumption: • Fuel efficient operations • Optimised ship handling • Hull and propulsion • Machinery and equipment • Cargo handling optimisation • Energy conservation and awareness
Greenhouse Gas (GHG) Emissions • Natural and Anthropogenic • The six most important GHGs are the Kyoto Basket: CO2, CH4, N2O, SF6, HFCs, PFCs • Large atmospheric CO2 increases since mid 19th Century
Radiative Forcing + Climate Change • GHGs are causing a radiative forcing of Earth’s atmosphere, increasing world temperatures • Climate Change is predicted to quicken unless emissions can be reduced IPCC 4th Assessment Report, 2007
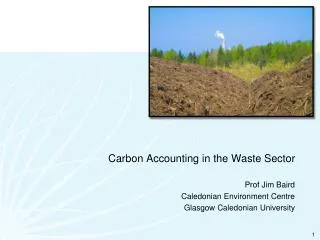
Need for Carbon Management • Need for decrease in anthropogenic GHG emissions • GHG Emissions can only be successfully reduced if they can be measured • Carbon Footprinting is a technique for relating a human activity to a certain amount of GHG emissions
Why quantify GHG emissions? • Legislative case • International & national commitments • Initiatives aimed at organisations • Business case • Corporate social responsibility (CSR) • GHG management strategy • Energy-efficiency & financial savings 24
Origin • Mid 1990s: new interest in measuring human environmental impact • Ecological Footprint: “A methodology for estimating the area of the Earth’s surface needed to provide all necessary resources to, and process waste and pollution from, a given population, organization or activity”
Footprint indicators • Water footprint • The Water Footprint of a country is the total volume of freshwater consumed and polluted for the production of goods and services consumed by citizens from a defined area (Hoekstra et al 2009).
Footprint indicators • Carbon Footprint • The Carbon Footprint indicator allows for a comprehensive assessment of human contribution to climate change which is consistent with standards of economic and environmental accounting. It offers an alternative angle for international policy on climate change as it complements the territorial-based approach used by the UNFCCC
Different Definitions • Multitude of different definitions • Wiedman and Minx (2008) include only CO2“The carbon footprint is a measure of the exclusive total amount of carbon dioxide emissions that is directly and indirectly caused by an activity or is accumulated over the life stages of a product”
Different Definitions • Moss, Lambert and Rennie (2008) disagree; stated that a carbon footprint should be: • “The total mass of greenhouse gases directly and indirectly emitted by an individual, a company or throughout the full lifecycle of a product.”
Carbon Footprint “A measure of the total amount of CO2 and CH4 emissions of a defined population, system or activity, considering all relevant sources, sinks and storage within the spatial and temporal boundary of the population, system or activity of interest. Calculated as CO2 equivalents using the relevant 100-year global warming potential” Wright et al (2011)
Climate Footprint + GHG Inventory Wright et al (2012)
Measuring Emissions • Largely voluntary: • External, Verified (Carbon Disclosure Project) • Internal, Verified (Lloyds Register, Carbon Trust…) • Internal, Unverified (self-reporting) • Using official guidelines (i.e. GHG Protocol) • Using own method
1. Boundary setting 2. Emissions source identification 3. Categorisation of sources by scope 4. Select calculation method 5. Collect data 6. Emissions quantification & documentation
Boundary setting • Temporal boundaries • Select base year • System boundaries • Consumption (Shipper) vs. production (Ship owner)
Who is responsible? • GHG mitigation traditional focus on sources • Little attention on drivers • Focus on drivers – more holistic approach to mitigation?
1. Boundary setting 2. Emissions source identification 3. Categorisation of sources by scope 4. Select calculation method 5. Collect data 6. Emissions quantification & documentation
Direct vs. indirect emissions • Direct emissions • Associated with the combustion of fuels (e.g. boilers, engines, etc.) • Process & fugitive emissions • Indirect emissions • Upstream & downstream emissions (e.g. energy generation, waste disposal/end-of-life, embodied emissions, etc.)
1. Boundary setting 2. Emissions source identification 3. Categorisation of sources by scope 4. Select calculation method 5. Collect data 6. Emissions quantification & documentation
1. Boundary setting 2. Emissions source identification 3. Categorisation of sources by scope 4. Select calculation method 5. Collect data 6. Emissions quantification & documentation
3: Emission Calculation Methods • Range of different methods for calculating emissions • Unit of Activity x Emission Factor = Emission Levels • Emission Factors for fuel, energy products, distance travelled, water consumption and waste generation
3: Emission Calculation Methods Wright et al (2012)
3: Emission Calculation Methods Wright et al (2012)
3: CO2e & GWP • Single unit of CO2e used. • CO2e= Carbon dioxide equivalent • GWP= Global Warming Potential • GWP100= for 100 years (most common) • The GWP of CH4 is 25 CO2e.
Process analysis (PA) • Bottom-up approach • Use of primary data (/direct measurements) • High level of accuracy and specificity • BUT labour- and time-intensive
Environment input-output analysis (EIOA) • Top-down approach • Use of secondary, sectoral-level data • Data from national statistics compilations • Less labour- and time intensive than PA • BUT also less accurate and subject-specific
Hybrid PA and EIOA approach 1. Preliminary assessment of emissions sources using EIOA. • Provides an overview of key emissions sources & identifies major contributors. 2. Use of PA to more accurately measure emissions from key sources For more information see: • Suh, S., Lenzen, M., Treloar, G. J., et al. (2004). System boundary selection in life-cycle inventories using hybrid approaches. Environmental Science & Technology, 38(3): 657-664. • Hondo, H. & Sakai, S. (2001). Consistent method for system boundary definition in LCA: an application of sensitivity analysis. Journal of Advanced Science, 13(3): 491-494.
Emissions factors • Applied in all situations where GHG emissions are not directly measured • Emission per unit of activity • E.g. tonnes CO2 per km travelled by vessel • Emissions = activity data x emission factor
Example: electricity • Scope 2 • Electricity consumed: 2,500 kWh • Emissions factors: • CO2 = 0.49927 kgCO2e/kWh • CH4 = 0.00025 kgCO2e/kWh