Download
1 / 54
540 likes | 782 Vues
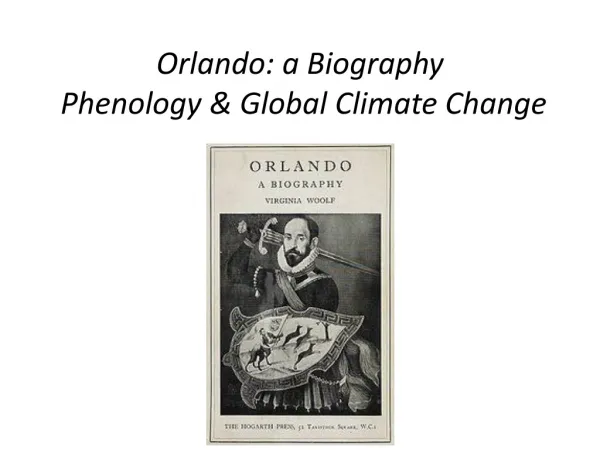
Orlando: a Biography Phenology & Global Climate Change. Excerpts from Orlando The Great Frost. The Great Frost was, historians tell us, the most severe that had ever visited these islands. Birds froze in midair and fell like stones to the ground (p. 25)

E N D
Excerpts from OrlandoThe Great Frost • The Great Frost was, historians tell us, the most severe that had ever visited these islands. Birds froze in midair and fell like stones to the ground (p. 25) • The severity of the frost was so extraordinary that a kind of petrifaction sometimes ensued; and it was commonly supposed that the great increase in rocks in some parts of Derbyshire was due to no eruption, for there was none, but to the solidification of unfortunate wayfarers who had been literally turned to stone where they stood (p. 26)
Frost on the Thames • From 1400 to the removal of the now-replaced medieval London Bridge in 1835, there were 24 winters in which the Thames was recorded to have frozen over at London
Frost on the Thames • During the Great Frost of 1683–84, the worst frost recorded in England, the Thames was completely frozen for two months, with the ice reaching a thickness of 11 inches (28 cm) in London (not 20 feet as described by Woolf).
Turn and Talk Prompts • What happened during the Great Frost according to Woolf? • How does the King’s decree compare to winter celebrations or events that you have experienced?
Frost on the Thames • Last time the Thames froze over was winter of 1963-1964. • There has been ice and snow, but no frozen river.
What are some impacts of cold winters before and after the Industrial Age? • Turn and talk
What are some impacts of cold winters before and after the Industrial Age? Before: • Scarcity of food and hunger • Agriculture and growing season was shortened by up to 20% • Snow covered the ground deeper into spring where a parasite that thrives in cold devastated crops, including hay • River flooding • Economic impacts of loss of fishing (cod) • Biodiversity impacts, including decrease in sea birds because sea was frozen
What are some impacts of cold winters before and after the Industrial Age? After: • Increased smog because of coal use for heating (led to clean air legislation) • Power lines down • Travel was problematic • Economics & commerce: Shipping lanes and ports were shut down • Disruption to the national sporting calendar • Biodiversity impacted: snow cover and frozen sea/rivers/lakes impact foraging for food in birds and mammals
What is the difference between weather and climate? • Turn and talk
What is the difference between weather and climate? • Weather describes the atmospheric conditions at a specific point in time • Example: our weather today is… • Weather generally describes short time frames - minutes, hours, days, and weeks. • Conditions associated with weather include (but are not limited to) sunshine, rain, cloud cover, winds, hail, snow, sleet, freezing rain, flooding, blizzards, ice storms, and thunderstorms
What is the difference between weather and climate? Climate refers to the statistics of weather: the average pattern for weather over a period of months, years, decades, or longer in a specific place. Climate has always varied because of natural causes El Nino which is an oscillation of the ocean- atmosphere system in the tropical Pacific Increasingly, however, human increases in greenhouse gas emissions are beginning to cause changes in climate as well.
What is the difference between weather and climate? • You pick your vacation destination based on the climate but pack your suitcase based on the weather.
Weather vs Climate • What is the difference between weather and climate? • http://nas-sites.org/climatemodeling/page_1_1.php
Overview of Phenology • “Phenology is the study of the cycling of biological events throughout the year, a reading of the ‘pulse of life’.” Bradley, Leopold, Ross, , & Huffzr. (1999) • Phenology (Merriam Webster’s Collegiate Dictionary): a branch of science dealing with the relations between climate and periodic biological phenomena (such as bird migration or plant flowering), ca. 1884
Phenological Evidence for Global Climate Change with Historical Dataset • Use historic data to understand species response to climate change • Match new data with old • Providing the same methods and locations were used
Overlay new data with old • Nina Bradley 1999 PNAS • 61 year record • Monitored phenology at the Leopold shack • Showed most species arrived/broke bud significantly earlier however, some did not. • Difference in response to temp/photoperiod • Where do the birds over winter? • Habitat competition (80 sp. of birds nest in tree snags) Bradley et al. 1999
What are implications of species earlier arrival? • Turn and talk
Common Regional & FeederBirds in Decline • In past 40 years: 71% Eastern Meadowlark http://en.wikipedia.org/wiki/File:Sturnella_magna_-Mexico-8.jpg
Common Regional & Feeder Birds in Decline • In past 40 years: 78% Purple Martin http://commons.wikimedia.org/wiki/File:PurpleMartin_cajay.jpg
Common Regional & Feeder Birds in Decline • In past 40 years: 62% Indigo Bunting http://commons.wikimedia.org/wiki/File:Indigo_Bunting.jpg
Common Regional & Feeder Birds in Decline • In past 40 years: 89% Red-headed Woodpecker Minnesota is home to 16 of the 20 birds declining fastest! Where are they going? http://commons.wikimedia.org/wiki/File:Melanerpes-erythrocephalus-003.jpg
Climate Change & Distribution http://www.audubon.org/bird/bacc/images/BACC_map.jpg
Heathrow Airport Data • Compare your two graphs • What is the story of the graphs?
Change since 1948 Source: Met Office Integrated Data Archive System (MIDAS) Land and Marine Surface Stations Data (1853-current)
What are some impacts ofa warming climate for London? • Models show progressive increases in both summer heat island intensity and frequency with climate change. This will have detrimental effects on air quality, summer electricity demand, and comfort in the city’s buildings and transport network. • Warmer temps reduce the amount of water available and increase demand in summer • Increase flooding • Tourism and recreational industries could increase in a warmer climate • Biodiversity
What is the Greenhouse Effect? • http://www.epa.gov/climatestudents/basics/today/greenhouse-effect.html
Global Climate Change • http://climate.nasa.gov/climate_reel/CarbonClimateChange
When did CO2 and other GHG begin to increase? Detailed analysis of ice cores and measurements shows: CO2 , CH4, and N2O changed slowly after the end of the last Ice Age, but began to increase rapidly about 200 years ago.
How much does each GHG contribute to climate change? CO2 • Energy retention in the atmosphere depends on the abundance and effectiveness of the GHG. • The diagram shows how much each gas contributed to warming from 1750 to 2005 (termed radiative forcing). CH4 N2O
Global Temperatures are increasing Green bars show 95% confidence intervals the 15 hottest years all occurred since 1990 http://data.giss.nasa.gov/gistemp/graphs/
Why do we think that CO2 released by human activities is causing the increase in the atmosphere? • Seasonal cycles in CO2 result from photosynthesis and respiration. • Such short-term flows of carbon cannot explain the upward trend • The trend has to result from carbon that has been stored for long periods of time, such as in fossil fuels and soils.
2007 Conclusions • Warming of the climate system is unequivocal • Very high confidence that global average net effect of human activities since 1750 one of warming • Human-caused warming over last 30 years has likely had a visible influence on many physical and biological systems • Continued GHG emissions at or above current rates would cause further warming and induce many changes in the global climate system during the 21st century that would very likely be larger than those observed during the 20th century.”
IPCC 2013:Warming of the climate system is unequivocal, and since the 1950s, many of the observed changes are unprecedented over decades to millennia. The atmosphere and ocean have warmed, the amounts of snow and ice have diminished, sea level has risen, and the concentrations of greenhouse gases have increased.
Why should we care? Temperature Anomoly
Communicating the Science of Climate Change • It’s not a matter of believing: The conclusion that the world is warming and that humans are primarily the cause is based on facts and evidence.


