Download
1 / 61
610 likes | 768 Vues
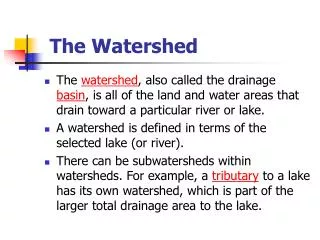
Monitoring Considerations BMP Guidance. Nancy Mesner, Dept of Watershed Sciences Utah State University nancy.mesner@usu.edu ; 435 797 7541. Common problems in BMP monitoring programs. Failure to design monitoring plan around BMP objectives

E N D
Monitoring Considerations BMP Guidance Nancy Mesner, Dept of Watershed Sciences Utah State University nancy.mesner@usu.edu; 435 797 7541
Common problems in BMP monitoring programs Failure to design monitoring plan around BMP objectives Failure to identify and quantify sources of variability in these dynamic systems. Failure to understand pollutant pathways and transformations choosing inappropriate monitoring approaches “One size fits all” monitoring programs
Focuses on the considerations and decisions necessary as a project is first being considered. NOT a “how-to” manual of protocols
Target Audience • State Environmental Agencies • Conservation Groups • Land Management Agencies • Citizen Monitoring Groups
What is your objective? • Long term trends? • UPDES compliance? • Educational? • Assessment for impairment? • Track response from an implementation?
How do pollutants “behave” within your watershed. • How does the pollutant move from the source to the waterbody? • How is the pollutant processed or transformed within a waterbody? • What is the natural variability of the pollutant? Will concentrations change throughout a season? Throughout a day? • What long term changes within your watershed may also affect this pollutant? • What else must be monitored to help interpret your data?
What to monitor? • Monitor the pollutant(s) of concern? • Monitor a “surrogate” variable? • Monitor a response variables? • Monitor the impacted beneficial use? • Monitor the BMP itself? • Monitor human behavior? • Model the response to a BMP implementation. • Collect other data necessary to interpret monitoring results OR calibrate and validate the model?
Choose appropriate monitoring or modeling Above-treatment monitoring stations Control Treatment “A” Below-treatment monitoring stations Sampling points Above and below treatment design BACI Design
How to monitor? • points in time versus continuous • integrated versus grab samples • consider: • cost • skill and training required • accessibility of sites
Before you establish actual monitoring sites Think about… • Where in the stream should you monitor? • Equipment limitations? • Legal and safe access? • Holding times of your samples?
When to collect samples? Consider: Seasonality? Flow? Night versus day? Storm events versus base flow? Discrete samples versus continuous samples?
Site specific considerations • Constraints may affect type of monitoring plan • Power needs / satellite or cell phone access • Timing – remote sites are difficult to fit into a tight monitoring schedule Includes how methods and data are stored and documented correctly. • Seasonal access • Safety • Site ownership
Protocols Physical / habitat Biological Water Column Behavioral monitoring
Water column monitoring (water chemistry) Advantages: Standardized methods repeatable , comparable Easy to collect Related to toxicity or other impacts Disadvantages: Discontinuous in time and space
Physical habitat monitoring (Stream form, substrate) Advantages: Reflects hydrologic impacts Relatively low cost Disadvantages: May not reflect actual water quality May be subjective, lack of repeatability
Biological monitoring (macroinvertebrates, algae, fish) Advantages: Integrates impacts over time Biological impacts = loss of beneficial use Easy to collect Disadvantages: Need for reference sites High degree of heterogeneity in samples
Quality Assurance and Quality Control • QA: Project management considerations, including how data will be stored, documentation of methods. • Assures that data collected are representative and accurate. • Determines the amount of “error” in the data and whether this is acceptable for your monitoring objectives. • Includes how methods and data are stored and documented correctly.
Quality Assurance and Quality Control • QC: Error control • Assures that samples are representative • Assures that samples are not contaminated or distorted by lab or field procedures, by sample handling, data handling, etc. • Provides built in feedback on project plan so improvements can be made.
How many samples need to be collected? • Consider…. • Statistical tests to be used • The smaller the change, the more samples you will need • High precision requires more samples • Your willingness to be wrong
Sampling considerations Standard operating procedures Calibration of equipment Quality assurance / quality control Chain of custody in samples Holding times Make sure field people understand what’s going on
Managing data • Figure this out BEFORE any sampling begins. • Don’t trust your memory • Field: • Good site and sample ID system • Metadata that help explain to others the system and the protocols • Lab/office records • Data sheet design – helps avoid missed observations • Transcribe data and results to electronic file system.
Managing data • Look at your data • Do results make sense? • Outliers • Do similar data sets correlate? Eg. is there a problem if you have high turbidity and low TSS?
Links to monitoring resources NRCS products and tools from the National Waters and Climate Center: http://www.wcc.nrcs.usda.gov/products.html Monitoring protocols: National Water Quality Monitoring Handbook, specifically Section 614 http://policy.nrcs.usda.gov/media/pdf/H_450_600_a.pdf US Environmental Protection Agency. “The Volunteer Monitor’s Guide to Quality Assurance Plans.” 1996. http://www.epa.gov/owow/monitoring/volunteer/qapp/vol_qapp.pdf US Environmental Protection Agency. “Techniques for Tracking, Evaluating, and Reporting the Implementation of Nonpoint Source Measures – Urban.” 2001. http://yosemite.epa.gov/ee/epa/riafile.nsf/Attachment+Names/W.2001.16.pdf/$File/W.2001.16.pdf?OpenElement US Environmental Protection Agency. “Guidance for Preparing Standard Operating Procedures.” 2007. <http://www.epa.gov/QUALITY/qs-docs/g6-final.pdf>
Links to modeling resources US EPAWaterQualityModelsandTools: This site includes information and guidance on several simulation models and tools for watershed and water quality monitoring (http://www.epa.gov/waterscience/models/). AGricultural Non-Point Source Pollution Model (AGNPS): continuous simulation surface runoff model designed to assist with determining BMPs, the setting of TMDLs, and for risk & cost/benefit analyses ttp://www.ars.usda.gov/Research/docs.htm?docid=5199). Soil Water Assessment Tool (SWAT): a river basin scale model developed to quantify the impact of land management practices in large and complex watersheds. SWAT is a public domain model supported by the USDA Agricultural Research Service (http://www.brc.tamus.edu/swat/). Kinematic runoff and erosion model (KINEROS2): is an event oriented, physically based model describing the processes of interception, infiltration, surface runoff and erosion from small agricultural and urban watersheds (http://www.tucson.ars.ag.gov/kineros/). River and Stream Water Quality Model (QUAL2K): a one dimensional river and stream water quality model for a well mixed, vertically and laterally channel with steady state hydraulics (http://www.epa.gov/athens/wwqtsc/html/qual2k.html).
Decision Tree • Identifies KEY components • Shows links between components • Links to information in the Guidance doc • Non – linear!!
Check List • Method to help identify KEY components that need to be considered • Takes one through the thought process.
The road to more effective monitoring…. • Monitoring plans require careful thought before anything is implemented. • Consider how the data will be used to demonstrate change. • Use your understanding of your watershed and how the pollutants of concern behave to target monitoring most effectively. • Use different approaches for different BMPs.
The road to more effective monitoring…. • Keep project goals and objectives in mind when monitoring BMPs • Monitor at an appropriate scale • Keep time lags in mind • Be selective, consider individual situations • Monitor surrogates when appropriate • Control or measure human behaviors / other watershed changes.
Thank You Questions?
Vol monitoring qaap guidance http://water.epa.gov/type/rsl/monitoring/upload/2002_08_02_monitoring_volunteer_qapp_qappexec.pdf Loads versus concentrations
Concentration (mass / volume) • The total amount of something in a specific volume of water. • Biological and chemical processes are a function of concentration • eg. toxicity, nutrient limits, oxygen depletion, etc. • Allows comparison with water quality criteria • What organisms actually experience
Load (mass / time) • The total amount (mass) of something in a waterbody at a given time • Biological and chemical processes are NOT a function of load.
Mass balance approach to identify areas of concern: • Loads: • Allow comparisons from site to site • Can determine losses and gains in pollutant loads from site to site. • links water quality data to pollution inputs from watershed.
Load = (mass / time) = concentration * flow = mass * volume = mass volume time time
Examples of variability in natural systems Nancy Mesner, Dept of Watershed Sciences Utah State University nancy.mesner@usu.edu; 435 797 7541 Ginger Paige, University of Wyoming University of Wyoming gpaige@uwyo.edu; (307) 766-2200
Understanding natural variability: Sources of error in sampling • Relationship of surrogate to target pollutant • Sampling frequency • Timing of sampling • Rare events
Upper watershed site Discharge (cfs) Lower watershed site October 2005 – October 2007
Upper Site Flow (cfs) and turbidity (NTU) • Seasonal and annual variation • Variation between sites • Different pathways of pollutants Lower Site Flow (cfs) and turbidity (NTU) January – December 2006
Variability in correlations between turbidity and water quality parameters (TSS and TP)