Download
1 / 29
300 likes | 503 Vues
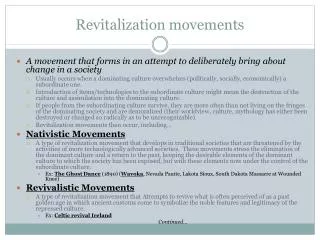
Urban Revitalization. PP170. Lessons from The Providence Plan. Professor: Patrick McGuigan Executive Director, ProvPlan. What is this?. College Hill. Federal Hill. Elmwood. How big is Providence?. Total Population. Providence. New York. Boston. 178,042 18.4 mi 2. 617,594

E N D
Urban Revitalization PP170 Lessons from The Providence Plan Professor: Patrick McGuigan Executive Director, ProvPlan
What is this? College Hill Federal Hill Elmwood
How big is Providence? Total Population Providence New York Boston 178,042 18.4 mi2 617,594 48.3 mi2 8,175,133 305 mi2 ? Population data from 2010 U.S. Census Bureau estimates
How economically successful are Providence families? Median Household Income Elmwood Federal Hill College Hill Providence New York Boston ? $28.750 - $31.436 $19.801 - $39.412 $42.069 - $60.938 $51,739 $36,925 $51,270 Economic data from ACS 2006-2010 U.S. Census Ranges represent the lowest and highest value census tracts within the neighborhood.
How economically successful are Providence families? Families Living Below Poverty Level Elmwood Federal Hill College Hill Providence New York Boston 25.3% - 28.8% 4.5% - 9.5% 0% -28.5% 16.2% 15.9% 21.5% ? Economic data from ACS 2006-2010 U.S. Census Ranges represent the lowest and highest value census tracts within the neighborhood.
How well educated are Providence families? Adults with a High School Degree Providence Elmwood Federal Hill College Hill 72.7% 95.3% - 100% 67.5% - 73.7% 60% - 62.4% Education data from ACS 2006-2010 U.S. Census Ranges represent the lowest and highest value census tracts within the neighborhood.
How much does property cost in Providence? Average Property Sales Value Providence (Median) Elmwood Federal Hill College Hill $110,000 $846,967 $197,694 $120,122 Housing data from: City of Providence, 3/22/12 – 4/5/13
Recognize that cities are complex places that can simultaneously experience success and failure • Allows for statistical comparisons of geographies within a city • Offers meaningful level of analysis for policymakers and residents • Helps to inform allocation of limited resources within cities • Provides a framework to measure the impact of policy-based and programmatic interventions Why is neighborhood level data on urban communities important?
Poverty in Providence Tracts with highest proportion of families in Poverty Households in Poverty ` Wanskuck Tract 27: 51.3% 47%+ 35% - 46% 31% - 34% 24% - 30% 16% - 23% 7% - 15% 4% - 6% Upper S. Prov. Tract 7: 64.2% Upper/Lower S. Prov. Tract 4: 48% Data from ACS 2006 - 2010 U.S. Census
Overall Population Change 2000 - 2010 Largest Population Increase Pop. Change 2010 (as % of 2000 pop.) Manton (57.4%) Downtown (65.3%) 14% - 65% 6.7% - 13% 2.5% - 6.6% 0.0% - 2.4% -4.3% - -0.1% -8.9% - -4.4% Largest Population Decrease Federal Hill (-8.9) Elmwood (-6.8%) Data from 2000 & 2010 U.S. Census
Change in Latino Population 2000 - 2010 Largest Population Increase Pop. Change 2010 (as % of 2000 pop.) Manton (138%) Downtown (120%) 93% - 139% 57% - 92% 25% - 56% 0.0% - 24% -2.6% - -0.1% -2.7% - -19% Population Decrease Smith Hill (-2.6) Federal Hill (-19.4%) Data from 2000 & 2010 U.S. Census
Change in Non-Latino White Population 2000 - 2010 Largest Population Increase Pop. Change 2010 (as % of 2000 pop.) Manton (15.1%) Downtown (44.4%) 15% - 44% 4.6% - 14% 4.1% - 4.5% 0.0% - 4.0% -23% - -0.1% -54% - -24% Notable Population Decrease South Elmwood decline (-37%) coincides with decrease in black population (-17%) and increase in vacant housing units (140%) Data from 2000 & 2010 U.S. Census
Jobs • Education • Housing • Safety • Declining Revenue & Increasing Costs Key challenges facing Providence (and most other urban communities)
Jobs in Providence Unemployment • How do we expand industry in Rhode Island and ensure residents are ready to meet the needs of growing employers? Rhode Island Providence 10.3% 8.8% Unemployment data from U.S. Bureau of Labor Statistics, April 2013
Unemployment in Providence • Why is unemployment distributed unevenly across the city?
Education in Providence Math Proficiency • How do we improve the quality of education for Providence youth without leaving more disadvantaged students behind? (8th grade) Rhode Island Providence 26% 54% Test score data from Rhode Island Department of Education (neighborhood data derived as median of neighborhood schools)
Education in Providence Source: http://infoworks.ride.ri.gov
4-Year High School Outcomes in Providence and Statewide Source: http://infoworks.ride.ri.gov
NECAP Scores Source: http://infoworks.ride.ri.gov
Housing in Providence 2009-2011 Foreclosures (as % of mortgaged housing stock) • How can we mitigate the impact of foreclosures on families living in urban areas and combat the blight of abandoned homes? Rhode Island Providence 9.78% 3.65% 1672 Homes 6,740 Homes Foreclosure Data: HousingWorksRI Annual Report Spring 2012
Public Safety in Providence Violent Crime Rate • How does Providence continue to build on the success of its community policing approach to improve public safety? (per 1000) Rhode Island Providence 6.93 2.9 Crime Data from: 2011 Uniform Crime Report (Crime in Rhode Island)
Declining Revenue & Increasing Costs Projected 2012 Deficit • In an era of tightening budgets, how do we make hard decisions about where to cut and where to invest? As % of Approved Budget Deficit Projection $110,000,000 17.8% Budget data from City of Providence
Be Strategic • Build Strong Partnerships • Advance Comprehensive Solutions • Take “What Works” to Scale • Align Revitalization with Political Action How to address the range of challenges facing Providence & other urban communities(all key themes for course)
The Work of The Providence Plan & Do Think • Provide residents and public agencies with data and information that can support smart decision making • Launch innovative service programs that address unmet community needs
ProvPlan’s Programmatic Initiatives Info Group New Roots Building Futures YouthBuild Providence Ready to Learn (R2LP)
Course Structure • Weeks 1-3: Analysis of the economic and political forces that have brought cities to where they are today • Weeks 4-9: An examination of four issues that must be addressed as an essential component of any urban agenda: • Weeks 10-13: Uphill battles and prospects for success – seeking comprehensive solutions for Providence • Jobs • Education • Housing • Public Safety
Student-Led Classes • Policy Briefs (2) • Final Group Project Course Assignments
PP170 Urban Revitalization local.provplan.org/pp170