Download
1 / 1
30 likes | 109 Vues
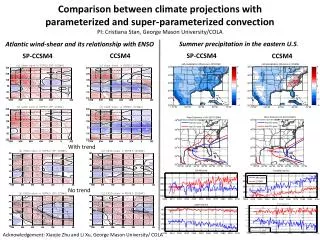
GPS derived Integrated Water Vapour content and its relationship with 6 years of surface radiation balance at MZS (Terra Nova Bay ).

E N D
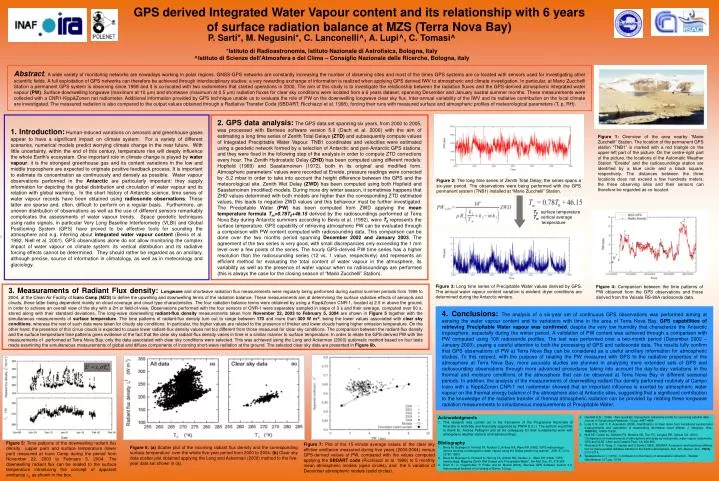
GPS derived Integrated Water Vapour content and its relationship with 6 years of surface radiation balance at MZS (Terra Nova Bay) Figure 2: The long time series of Zenith Total Delay; the series spans a six-year period. The observations were being performed with the GPS permanent system (TNB1) installed at “Mario Zucchelli” Station. Figure 3: Long time series of Precipitable Water values derived by GPS. The annual water vapour content variation is evident: dryer conditions are determined during the Antarctic winters. Figure 4: Comparison between the time patterns of PW obtained from the GPS observations and those derived from the Vaisala RS-80A radiosonde data. P. Sarti*, M. Negusini*, C. Lanconelli^, A. Lupi^, C. Tomasi^*Istituto di Radioastronomia, Istituto Nazionale di Astrofisica, Bologna, Italy^Istituto di Scienze dell’Atmosfera e del Clima – Consiglio Nazionale delle Ricerche, Bologna, italy Abstract.A wide variety of monitoring networks are nowadays working in polar regions. GNSS-GPS networks are constantly increasing the number of observing sites and most of the times GPS systems are co-located with sensors used for investigating other scientific fields. A full exploitation of GPS networks can therefore be achieved through interdisciplinary studies; a very rewarding exchange of information is realized when applying GPS derived IWV to atmospheric and climate investigation. In particular, at Mario Zucchelli Station a permanent GPS system is observing since 1998 and it is co-located with two radiometers that started operations in 2000. The aim of this study is to investigate the relationship between the radiation fluxes and the GPS-derived atmospheric integrated water vapour (PW). Surface downwelling longwave (maximum at 10 m) and shortwave (maximum at 0.5 m) radiation fluxes for clear sky conditions were isolated from a 6 years dataset, spanning December and January austral summer months. These measurements were collected with a CNR1-Kipp&Zonen net radiometer. Additional information provided by GPS technique unable us to evaluate the role of PW on the downwelling longwave clear sky flux. Inter-annual variability of the IWV and its radiative contribution on the local climate are investigated. The measured radiation is also compared to the output values obtained through a Radiative Transfer Code (SBDART, Ricchiazzi et al. 1998), forcing their runs with measured surface and atmospheric profiles of meteorological parameters (T, p, RH). 1. Introduction:Human-induced variations on aerosols and greenhouse gases appear to have a significant impact on climate system. For a variety of different scenarios, numerical models predict worrying climate change in the near future. With little uncertainty, within the end of this century, temperature rise will deeply influence the whole Earth’s ecosystem. One important role in climate change is played by water vapour: it is the strongest greenhouse gas and its content variations in the low and middle troposphere are expected to originate positive feedback process. It is important to estimate its concentration as continuously and densely as possible. Water vapour observations performed in the Antarctic are particularly important: they supply information for depicting the global distribution and circulation of water vapour and its relation with global warming. In the short history of Antarctic science, time series of water vapour records have been obtained using radiosonde observations. These latter are sparse and, often, difficult to perform on a regular basis. Furthermore, an uneven distribution of observations as well as the use of different sensors remarkably complicates the assessments of water vapour trends. Space geodetic techniques using radio signals, in particular Very Long Baseline Interferometry (VLBI) and Global Positioning System (GPS) have proved to be effective tools for sounding the atmosphere and e.g. inferring about integrated water vapour content (Bevis et al. 1992, Niell et al. 2001). GPS observations alone do not allow monitoring the complex impact of water vapour on climate system: its vertical distribution and its radiative forcing effects cannot be determined. They should rather be regarded as an ancillary, although precise, source of information in climatology, as well as in meteorology and glaciology. 2. GPS data analysis:The GPS data set spanning six years, from 2000 to 2005, was processed with Bernese software version 5.0 (Dach et al. 2006) with the aim of estimating a long time series of Zenith Total Delays (ZTD) and subsequently compute values of Integrated Precipitable Water Vapour. TNB1 coordinates and velocities were estimated using a geodetic network formed by a selection of Antarctic and peri-Antarctic GPS stations, and they were fixed in the following step of the analysis in order to compute ZTD corrections every hour. The Zenith Hydrostatic Delay (ZHD) has been computed using different models: Hopfield (1969) and Saastamoinen (1972), both in its original and modified form. Atmospheric parameters’ values were recorded at Eneide, pressure readings were corrected by -5.2 mbar in order to take into account the height difference between the GPS and the meteorological site. Zenith Wet Delay (ZWD) has been computed using both Hopfield and Saastamoinen (modified) models. During more dry winter season, it sometimes happens that ZHD values determined with both models are higher than the corresponding ZTD estimated values, this leads to negative ZWD values and this behaviour must be further investigated. The Precipitable Water (PW) has been computed from ZWD applying the mean temperature formula Tm=0.78T0+46.15 derived by the radiosoundings performed at Terra Nova Bay during Antarctic summers according to Bevis et al. (1992), were T0 represents the surface temperature. GPS capability of retrieving atmospheric PW can be evaluated through a comparison with PW content computed with radiosounding data. This comparison can be done over the two months period spanning December 2002 and January 2003.The agreement of the two series is very good, with small discrepancies only exceeding the 1 mm level over a few points of the series. The hourly GPS-derived PW time series has a higher resolution than the radiosounding series (12 vs. 1 value, respectively) and represents an efficient method for evaluating the total content of water vapour in the atmosphere, its variability as well as the presence of water vapour when no radiosoundings are performed (this is always the case for the closing season of “Mario Zucchelli” Station). Figure 1: Overview of the area nearby “Mario Zucchelli” Station. The location of the permanent GPS station “TNB1” is marked with a red triangle on the upper left part of the picture. On the centre-right part of the picture, the locations of the Automatic Weather Station “Eneide” and the radiosoundings station are identified by a blue circle and a black square, respectively. The distances between the three locations does not exceed a few hundreds meters; the three observing sites and their sensors can therefore be regarded as co-located. T0surface temperature Tm vertical average temperature 3. Measuraments of Radiant Flux density: Longwave and shortwave radiation flux measurements were regularly being performed during austral summer periods from 1999 to 2004, at the Clean Air Facility of Icaro Camp (MZS) to define the upwelling and downwellingterms of the radiation balance. These measurements aim at determining the surface radiative effects of aerosols and clouds, these latter being dependent mainly on cloud coverage and cloud type characteristics. The four radiation balance terms were obtained by using a Kipp&Zonen CNR-1, located at 2.5 m above the ground, in order to achieve an overall view of the sky with a 2π sr field-of-view. Observations performed with the four sensors of CNR-1 were separately sampled in steps of 3 s and their average, computed over 60 s, stored along with their standard deviations.The long-wave downwelling radiant-flux density measurements taken from November 22, 2003 to February 5, 2004 are shown in Figure 5 together with the simultaneous measurements of surface temperature. The time patterns of radiant-flux density turn out to range between 170 and more than 300 W m-2, being the lower values associated with clear sky conditions, whereas the rest of such data were taken for cloudy sky conditions. In particular, the higher values are related to the presence of thicker and lower clouds having higher emission temperature. On the other hand, the presence of thin cirrus clouds is expected to cause lower radiant-flux density values not too different from those measured for clear sky conditions. The comparison between the radiant-flux density and the surface temperature time patterns gives evidence of the fact that the clear sky radiant-flux density varies in time in a similar manner to surface temperature.In order to relate the GPS-derived PW with the measurements of performed at Terra Nova Bay, only the data associated with clear sky conditions were selected. This was achieved using the Long and Ackerman (2000) automatic method based on four tests made examining the simultaneous measurements of global and diffuse components of incoming short-wave radiation at the ground. The selected clear sky data are presented in Figure 6b. 4. Conclusions:The analysis of a six-year set of continuous GPS observations was performed aiming at sensing the water vapour content and its variations with time in the area of Terra Nova Bay. GPS capabilities of retrieving Precipitable Water vapour was confirmed, despite the very low humidity that characterize the Antarctic troposphere, especially during the winter period. A validation of PW content was achieved through a comparison with PW computed using 108 radiosonde profiles. The test was performed over a two-month period (December 2002 – January 2003), paying a careful attention to both the processing of GPS and radiosonde data. The results fully confirm that GPS observations of PW at Terra Nova Bay can be considered as a useful ancillary information for atmospheric studies. To this respect, with the purpose of relating the PW measured with GPS to the radiative properties of the atmosphere at Terra Nova Bay, more accurate studies are planned in analyzing more extended sets of GPS and radiosounding observations through more advanced procedures taking into account the day-to-day variations in the thermal and moisture conditions of the atmosphere that can be observed at Terra Nova Bay in different seasonal periods. In addition, the analysis of the measurements of downwelling radiant flux density performed routinely at Campo Icaro with a Kipp&Zonen CNR-1 net radiometer showed that an important influence is exerted by atmospheric water vapour on the thermal energy balance of the atmosphere also at Antarctic sites, suggesting that a significant contribution to the knowledge of the radiative transfer of thermal atmospheric radiation can be provided by relating these longwave radiation measurements to simultaneous measurements of Precipitable Water. • Acknowledgments • This research was carried out in the framework of the Programma Nazionale di Ricerche in Antartide and financially supported by PNRA S.C.r.l. The authors would like to thank Dr. Andrea Pellegrini and all his colleagues for their fundamental work with atmospheric weather stations and radiosoundings. • Bibliography • Bevis M, Businger S, Herring TA, Rocken C, Anthes RA, Ware RH (1992) "GPS meteorology: remote sensing of atmospehric water vapour using the Global positioning system", JGR, 97, D14, 15787-15801 • Bevis M, Businger S, Chiswell S, Herring TA, Anthes RA, Rocken C, Ware RH (1994) "GPS meteorology: Mapping Zenith Wet Delays onto Precipitable Water", Am Met Soc, 33, 379-386 • Dach R., U. Hugentobler, P. Fridez and M. Meindl (2006), Bernese GPS Software Version 5.0, Astronomical Institute of University of Berne, 612 pp. • Hopfield H.S., (1969) - Two-quadratic tropospheric refractivity profile for correcting satellite data- Journal of Geophysical Research, 74, pp. 4487-4499 • Long C.N. and T. P. Ackerman (2000), Identification of clear skies from broadband pyranometer measurements and calculation of downwelling shortwave cloud effects, J. Geophys. Res., 105(D12), 15609-15626. • Niell AE, Coster AJ, Solheim FS, Mendes VB, Toor PC, Langley RB, Upham CA (2001) "Comparison of measurements of atmospheric wet delay by radiosonde, water vapour radiometer, GPS and VLBI" J Atm and Oceanic Tech, 18, 830-850 • Ricchiazzi P, S. Yang, C. Gautier and D Sowle (1998), SBDART: A research and teaching software tool for plane-parallel radiative transfer in the Earth’s atmosphere, Bull. Am. Meteor. Soc., 79(10), 2101-2114. • Saastamoinen I.I. (1973) - Contribution to the theory of atmospheric refraction - Bulletin Géodésique, 107, pp. 13-34 Figure 7: Plot of the 15-minute average values of the clear sky effctive emittance measured during five years (2000-2004) versus GPS-derived values of PW, compared with the values computed applying the SBDART code (Ricchiazzi et al. 1998) to 5 monthly mean atmospheric models (open circles), and the 5 variation of December atmospheric models (solid circles). Figure 6:(a) Scatter plot of the incoming radiant flux density and the corresponding surface temperature over the whole five-year period from 2000 to 2004; (b) Clear sky data scatter plot obtained applying the Long and Ackerman (2000) method to the five-year data set shown in (a). Figure 5: Time patterns of the downwelling radiant flux density (upper part) and surface temperature (lower part) measured at Icaro Camp during the period from November 22, 2003 to February 5, 2004. The downwelling radiant flux can be related to the surface temperature introducing the concept of apparent emittance ea as shown in the box.