Download
1 / 28
280 likes | 384 Vues
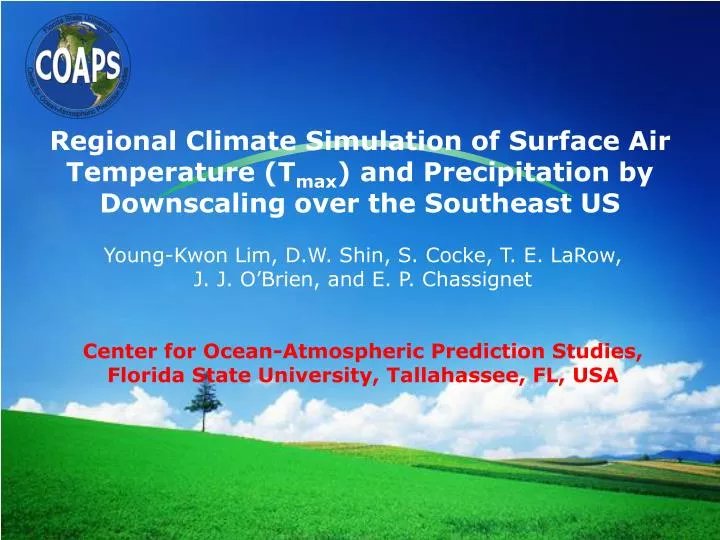
Regional Climate Simulation of Surface Air Temperature (T max ) and Precipitation by Downscaling over the Southeast US.

E N D
Regional Climate Simulation of Surface Air Temperature (Tmax) and Precipitation by Downscaling over the Southeast US Young-Kwon Lim, D.W. Shin, S. Cocke, T. E. LaRow, J. J. O’Brien, and E. P. Chassignet Center for Ocean-Atmospheric Prediction Studies, Florida State University, Tallahassee, FL, USA
Why downscaling over the SE USA? • Extremely high temperature and heavy rainfallwith severe storms during summer, resulting in potentialproperty damage and injuries. • The largest areas ofagricultural farmsin the nation. • An accurateforecast with higher spatial resolution is essentialto adapt management, increase profits, reduce production risks, and mitigate damages.
Simulation of regional climate by FSU • FSU/COAPS Global Spectral Model(FSU/COAPS GSM) has been downscaled to the20km gridresolution byFSU/COAPS nested regional spectral model(FSU/COAPS NRSM) over the southeast US. Dynamical Downscaling • FSU/COAPS NRSM : 1)Same physicsas the GSM, 2) 3 or 6 hr nesting interval, and 3) Output :Surface T, prcp., and radiative variables. • Statistical downscaling model has been also developed. (CSEOF, multiple regression, and stochastic PC generation are used.)
Observation FSU GSM 0.2° 0.2° (~20km res.) 1.8° 1.8° (~180km res.) CSEOF analysis Training & Predictor : model output Regression Predictand: observation Regressed eigenfunctions of GSM runs overtraining periodused CSEOF PC generation (for the prediction period) Prediction period Eigenfunctions of the Obs. over training period and the Generated CSEOF PC used Downscaled data construction Withholding different year for Cross-validation Output
Data (Obs. & Model) and period • Variables : Daily Tmax, Tmin, and precipitation • Period : 1994 ~ 2002 (March ~ September each year (daily)) • Observed data source : National Weather Service Cooperative Observing Program surface data over the southeast US : ~20km×20km • Large-scale model data : FSU/COAPS GSM : ~1.8°×1.8° (T63), initial condition centered on Mar. 1 each year, seasonally integrated.
Results • 2-d monthlymean field (Obs. GSM, NRSM, and Statistical Down.) • Time series of monthly Tmax anomalyover the selected local grids (Tallahassee, Jacksonville, Orlando, Miami, Atlanta, Tifton, Birmingham, and Huntsville) • Time series ofseasonal T anomaly and correlations • Categorical Predictability(%) for above/below seasonal T climatology • Predictability (e.g.,rainy/dry, false alarm, HSS) for precipitation • Correlation and3-category predictabilityfor summer monthly prcp.
Monthly mean field (1994) Spring Summer
Monthly anomaly time series Black solid : ObservationRed solid : statistical downscalingBlue solid : FSU/COAPS NRSM • Peaks seen in the observation are reasonably capturedby both downscaling methods. • Both methods appear to have comparable skillin reproducing the observed fluctuations. • Poor coincidence in peaksbetween the downscaled and the observed time series are foundat a few time steps(e.g., e, g, and h in 96 and 97).
Seasonal anomaly Time series Black solid : ObservationRed solid : statistical downscalingBlue solid : FSU/COAPS NRSM Green dashed : GSM • Both downscaled time series tend toundulate in accordance withthe observed time series • Incorrect predictions : 94 summer, 95 spring, and 97 spring • The relatively poor downscaling at these periods arises from poor simulation of the GSM anomaly.
Anomaly Correlation Top : Statistical downscalingMiddle : FSU/COAPS NRSMBottom : Difference seasonal, monthly • Correlation rangesfrom 0.3 to 0.8over most of grids (seasonal). • Floridaregion tends to behighly correlated with observation. • Differences do not exceed the magnitude 0.1, indicatingany of these methods is not significantly betterthan the other.
Categorical evaluationLeft : Correct forecast (%),second column: (+) forecast but (-) obs.(%),third : (-) forecast but (+) obs. (%),right : Heidke skill score SD NRSM
MAE and Correlation for frequency of daily extreme event Top : Statistical downscalingMiddle : FSU/COAPS NRSMBottom : Difference • Correlations exceed 0.4except for N. Georgia and Alabama, and SW tip of Florida. • Corr. : Statistical downscalingshows higher correlations. • MAE : Statistical downscaling shows greater MAE thandynamical downscaling.(significant overestimation / underestimation should be improved specifically in the statistical downscaling method.)
Categorical evaluation for rainfall event Left : Correct forecast (%),second column: False alarm ratio (%),third : Prcp. missed (%),right : Heidke skill score SD NRSM
Monthly anomaly correlation & Categorical predictability (summer)
Concluding remarks • Daily Tmax and Prcp. obtained from FSU/COAPS GSM (~1.8°lon.-lat., T63, seasonal integration) run have beendownscaled to local spatial scale of ~20km for the southeast US region,covering Florida, Georgia, and Alabama. • Both downscalings better reproduce the regional-scale features of temperature and precipitation than the GSM. • A series of evaluations reveal thatboth downscaling methods reasonably produces the local climate scenariofrom large-scale simulations. Skills for T is greater than precipitation. Skills of both methods are comparable to each other. • FSU COAPS is the leading institution for regional climate simulation(downscaling) for seasonal forecast and crop model application over the southeast US. • Still remains aroom for the improvementin predictive skill.
Statistical downscaling procedure (1) 1. Cyclostationary EOF analysis for the model output and the observation : CSEOF (Kim and North 1997) : analysis technique for extracting the spatio-temporal evolution of physical modes (e.g., seasonal cycle, ENSO, ISOs, etc.) and their long-term amplitude variations. P(r,t)=∑nSn(t) Bn(r,t) Bn(r,t) : time-dependent eigenfunctions, Sn(t) : PC time series. In this study, CSEOF is conducted on both observation and FSUGSM runs over the training period.
Statistical downscaling procedure (2) 2. Multiple regression between the model output and the observation : CSFOF PC time series of the first significant modes of a predictor variable (FSUGSM data) are regressed onto a certain PC time series of the target variable (observation) in the training period. PCTn(t)=∑iαni·PCPi(t)+ε(t) i=1,2,…10 PCTn(t): target PC time series, αni: regression coefficient PCPi(t): predictor PC time series Relationship between model output and the observation is extracted from CSEOF and multiple regression.
Result of multiple regression PC time series ? (training period) forecast period Eigenfunction (from Observation) Regressed Eigenfunction (model) Both are physically consistent.
Result of multiple regression Eigenfunction (from Observation) Regressed Eigenfunction (model)
Statistical downscaling procedure (3) 3. Generating CSEOF PC of the model data over the forecast period from the regressed fields in the training : CSFOF PC time series of the model data are generated for the prediction period. Modeled data and the regressed eigenfunctions identified from training are used. PCn(t)=∑gP(g,t)·Bn+(g,t) PCn(t): the nth mode PC time series for the prediction period g : large-scale grid point Bn+(g,t) : regressed CSEOF eigenfunctions P(g,t): global model anomaly over the prediction period
Statistical downscaling procedure (4) 4. Downscaled data construction from the eigenfunctions of the observation and the generated CSEOF PC time series : D(s,t)=∑nPCn(t)·Bno(s,t) PCn(t) : generated PC time series from the previous step Bno(s,t): CSEOF eigenfunctions of the observation (training period) D(s,t) : downscaled output 5. Generating downscaled output for the entire period (9yrs) by cross-validation framework
Observation FSU GSM 0.2° 0.2° (~20km res.) 1.8° 1.8° (~180km res.) CSEOF analysis Training & Predictor : model output Regression Predictand: observation Regressed eigenfunctions of GSM runs overtraining periodused CSEOF PC generation (for the prediction period) Prediction period Eigenfunctions of the Obs. over training period and the Generated CSEOF PC used Downscaled data construction Withholding different year for Cross-validation Output
Monthly time series(Tmax)Black solid : ObservationRed solid : statistical downscalingBlue solid : FSU/COAPS NRSMGreen dashed : FSU/COAPS GSM • Downscaled results are closer to observation than FSU/COAPS GSM. • Warm or cold biases unveiled from GSM have been corrected by downscaling.
Seasonal mean field (example: 97-98 summer) • Interannual temperature difference between the two years. • Higher (lower) T in 98 (97) with detailed spatial structure is simulated by the two downscaling methods. • The GSM fields have limited capability to realize the regional temperature fields over the domain.
The number of extreme Tmax events Black solid : ObservationRed solid : statistical downscalingBlue solid : FSU/COAPS NRSM • Extreme T events : exceed the one standard deviation plus climatology. • Interannual change in the occurrences of extreme Tmax (warmer T) events are fairly captured at individual grids by both downscalings.
Mean absolute error Top : Statistical downscalingMiddle : FSU/COAPS NRSMBottom : FSU/COAPS GSM (interpolated) • MAE: 0.8 ~ 2°C (GA, AL). • MAE: 0.4 ~ 1.5°C (FL). • FSU/COAPS NRSM (dynamical downscaling) has the smallest biases.
Categorical evaluation • Two categories : above average and below average • Correct forecast : the same sign of anomalies between observation and the downscaled forecast (Paa, Pbb) • Incorrect forecast : opposite anomalies between observation and downscaled forecast (Pab, Pba) , • Heidke skill score : PE : probability of a random forecast (F and P are independent)