Download
1 / 65
1.14k likes | 2.31k Vues
Atomic Absorption Spectroscopy (AAS). Topics to be covered. Importance of elemental analysis . Introduction to spectroscopy. Atomic Absorption Spectroscopy (AAS Atomic Emission Spectroscopy (AES). Inductively Coupled Plasma Spectroscopy (ICP).

E N D
Topics to be covered Importance of elemental analysis . Introduction to spectroscopy. Atomic Absorption Spectroscopy (AAS Atomic Emission Spectroscopy (AES). Inductively Coupled Plasma Spectroscopy (ICP).
Importance of elemental analysis Monitoring levels of certain elements in samples ( eg. pharmaceutical products and standards) to detect the concentrations of these elements. homodyalysis protonialdyalysis ringer lactate Monitoring the levels of the toxic elements in samples ( eg. cosmetics, food supplements, entire plant or part of it) to ensure it’s safety. With these information, we can take steps to approve or withdraw products from the markets. • Widely used in clinical chemistry and environmental laboratories.
Elements (Heavy Metals) The term heavy metal refers to any metallic chemical element that has a relatively high density and is toxic or poisonous at low concentrations. They have a specific gravity that is at least 5 times the specific gravity of water. Example: Arsenic 5.7,Cadmium 8.65 , Iron 7.9, Lead 11.34 Mercury 13.546
Trace elements : Heavy metals that are nutritionally essential for a healthy life. Examples are ( Iron, Manganese, Copper and Zinc).
Arsenic Lead Mercury Commonly encountered toxic heavy metals • Cadmium • Iron • Aluminum
Types of samples for analysis Pharmaceutical product Standards Cosmetics • Food supplements • Entire plant or part of it • Mixture of known & unknown herb
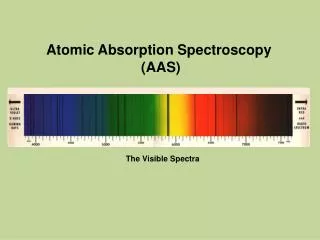
Spectroscopy • Spectrometric methods are a large group of analytical methods • Spectroscopy is the science that deals with the interactions of radiation with matter (atomic and molecular). • The most widely used spectrometric methods are based on electromagnetic radiation (light, gamma rays, X-rays, UV, microwave, and radio-frequency).
Electromagnetic Radiation: • consists of discrete packets of energy, which we call photons • A photon consists of an oscillating electric field component, E, and an oscillating magnetic field component, M.
The characteristics of these fields are: Orthogonal ( perpendicular ) to each other Orthogonal to the direction of propagation of the photon They flip direction as the photon travels All photons (in a given, non-absorbing medium) travel at the same velocity, v.
What is Frequency ()? The number of flips, or oscillations, that occur in one second. What is A Wavelength ()? • The physical distance in the direction of propagation over which the electric and magnetic fields of a photon make one complete oscillation. Unit: Angstrom, nm, µm • Velocity Of Light = 2.99792 x 10⁸ m/s The electromagnetic nature of all photons is the same, but photons can have different frequencies
v= The relationship between the light velocity, wavelength, and frequency is : The energy, E, of one photon depends on its frequency of oscillation : where h is Planck's constant (6.62618x10⁻³⁴ J·s) E = h = hv /
The relationship between the speed of light c , wavelength, and frequency is : When light passes through other media, the velocity of light Since the energy of a photon is fixed, the frequency of a photon does not change. Thus for a given frequency of light, the wavelength must as the velocity decreases. The decrease in velocity is quantitated by the refractive index, n, which is the ratio of c to the velocity of light in another medium, v: C= n = c / v
1- Absorption of Radiation • When radiation passes through a layer of solid, liquid, or gas, certain frequencies may be absorbed, a process in which electromagnetic energy is transferred to the sample.
Absorption promotes these particles from their ground state to more higher-energy excited state.
Tow types of absorption spectra: • Atomic absorption spectrum. • Molecular absorption spectrum.
Beer’s Law • Many compounds absorb radiation. The diagram below shows a beam of monochromatic radiation of radiant power P0directed at a sample solution. • Absorption takes place and the beam of radiation leaving the sample has radiant power P.
The amount of radiation absorbed may be measured in a number of ways: • Transmittance, T = P / P0% Transmittance, %T = 100 T • Absorbance, • A = log10P0/ PA = log10 1 / TA = log10 100 / %TA = 2 - log10 %T
The last equation, A = 2 - log10 %T , is worth remembering because it allows you to easily calculate absorbance from percentage transmittance data. • The relationship between absorbance and transmittance is illustrated in the following diagram:
The equation representing the Beer’s law: A = ε b c • Where • A is absorbance (no units, A = log10P0/ P ). • ε is the molar absorbtivity (is a measure of the amount of light absorbed per unit concentration) with units of L mol-1 cm-1. • b is the path length of the sample that is, the path length of the cuvette in which the sample is contained. We will express this measurement in centimeters. • c is the concentration of the compound in solution, expressed in mol L-1.
Beer’s law tells us that absorbance depends on the total quantity of the absorbing compound in the light path through the cuvette. If we plot absorbance against concentration, we get a straight line passing through the origin (0,0).
The working curves are used to Determine the concentration of an unknown sample. To calibrate the linearity of an analytical instrument.
What are the Processes by which a molecule can absorb radiation? 1- Rotational transition: The molecule rotate about various axes, the energy of rotation being at definite energy levels, so the molecule may absorb radiation and be raised to a higher rotational energy level.
2- Vibrational transition: The atoms or group of atoms within a molecule vibrate relative to each other. The molecule may then absorb a discrete amount of energy and be raised to a higher vibrational energy level..
3- Electronic transition: The electrons of molecule may be raised to a higher electron Energy. The three types of internal energy are quantized
Rotational transitions: low energy E [long λ (microwave or far-infrared)] Vibrational transitions: takes place at high energy E [ near, far infrared region] Electronic transitions: takes place at higher energy E [visible and U.V region]
Which molecules or atoms can absorb radiation? Molecules: • For absorption to occur there must be change in the dipole moment (polarity) of the molecule. i.e polar covalent bond in which a pair of electrons is shared unequally. eg: of a molecule that can not exhibit a dipole moment. N N Can not exhibit a dipole and will not absorb in the I.R region. eg. of a molecule that can exhibit a dipole moment. O C O Unsymmetrical diatomic molecule, does have a permanent dipole and so will absorb light. OCO Vibration mode symmetry and no dipole moment OCO By induced dipole dipole moment and the molecule can absorb I.R radiation.
Atoms:Incase of atoms only electronic transition occurs. P O N M L K
Atomic Absorption Spectroscopy (AAS) AAS was employed in the 1950’s Used for qualitative and quantitative detection. It’s used for the determination of the presence and concentrations of metals in liquid samples. Metals that can be detected include Fe, Cu, Al, Pb, Ca, Zn, Cd and many more. Concentrations range is in the low mg/L (ppm) range.
The simple diagram for the AAS 4. The element in the sample will absorb some of the light, thus reducing its intensity 5. The monochromator isolates the line of interest 3. A beam of UV light will be focused on the sample 1. We set the instrument at certain wavelength suitable for a certain element 2. The element in the sample will be atomized by heat 6. The detector measures the change in intensity 7. A computer data system converts the change in intensity into an absorbance
The disadvantage of both the HCL and laser is that they have narrow-band light sources and so only one element is measurable at a time.
2. Laser: They are intense enough to excite atoms to higher energy levels. This allows AA and atomic fluorescence measurements in a single instrument.
Note: Simple dedicated AA instruments often replace the monochromator with a bandpass interference filter.
A. Flame Atomic Absorption Spectroscopy: • The technique requires a liquid sample to be aspirated, aerosolized, and mixed with combustible gases, such as acetylene and air or acetylene and nitrous oxide. • The mixture is ignited in a flame whose temperature ranges from 2100 to 2800 ºC.
1. Nebulizer: 4. The mixture flows immediately into the burner head. 5. It burns as a smooth, laminar flame evenly distributed along a narrow slot. 1. mixes acetylene (the fuel) and oxidant (air or nitrous oxide). 3. The result is a heterogeneous mixture of gases (fuel + oxidant) and suspended aerosol (finely dispersed sample). 2. A negative pressure is formed at the end of the small diameter, plastic nebulizer tube (aspiration). 6. Liquid sample not flowing into the flame collects in the waste. Note: When do we use NO2 ?
2. Ignition: The process of lighting the AAS flame involves: turning on first the fuel then the oxidant and then lighting the flame with the instrument's auto ignition system. The flame breaks down the analyte's matrix create the elemental form of the analyte atom.
During combustion, atoms of the element of Interest in the sample are reduced to free, unexcited ground state atoms, which absorb light at characteristic wavelengths, as shown in the figure.
Optimization is accomplished by : Aspirating a solution containing the element Adjusting the fuel/oxidant mix until the maximum light absorbance is achieved. Careful control of the fuel/air mixture is important because each element's response depends on that mix in the burning flame.
3. Lamp (Hollow Cathode Lamb): Consists of a cathode and an anode. The cathode is made of the element of interest • A large voltage across the anode and cathode will cause the inert gas to ionize. • The inert gas ions will then be accelerated into the cathode, sputtering off atoms from the cathode. • Both the inert gas and the sputtered cathode atoms will in turn be excited by collisions with each other.
4- When these excited atoms decay to lower energy levels they emit a few spectral lines characteristic of the element of interest. 5- The light is emitted directionally through the lamp's window, a window made of a glass transparent in the UV and visible wavelengths. 6- The light can then be detected and a spectrum can be determined.
4. Monochromator : The light passes from the HCL through the element in the sample to the monochromator. It’s function is: It isolates the specific light of the element of interest from the other background lights and transfers it to the photomultiplier tube (detector).