Download
1 / 27
270 likes | 430 Vues
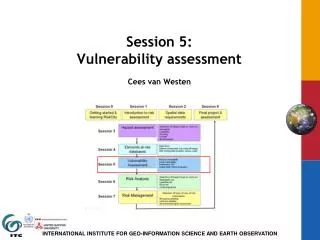
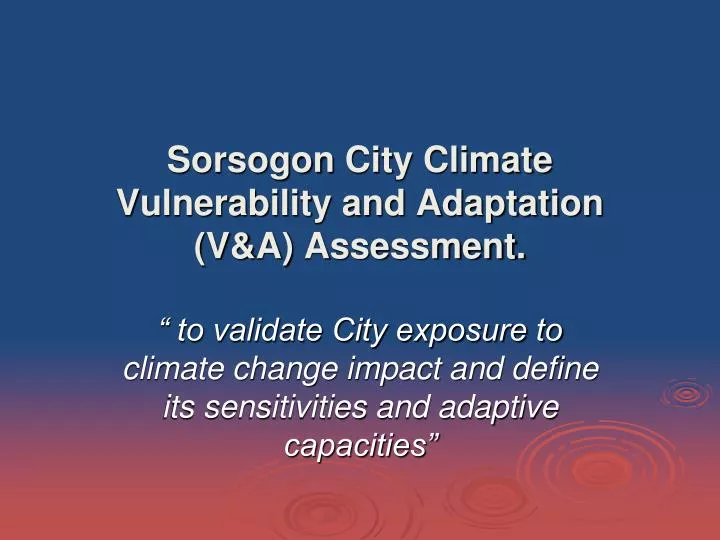
Sorsogon City Climate Vulnerability and Adaptation (V&A) Assessment. “ to validate City exposure to climate change impact and define its sensitivities and adaptive capacities”. V&A Assessment Process. Formation of Technical Working Group Definition and agreement on objective and framework

E N D
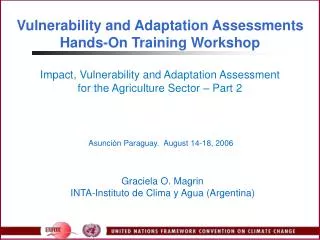
Sorsogon City Climate Vulnerability and Adaptation (V&A) Assessment. “ to validate City exposure to climate change impact and define its sensitivities and adaptive capacities”
V&A Assessment Process • Formation of Technical Working Group • Definition and agreement on objective and framework • Localizing of climate change scenario/exposure • Assessment of sensitivities (hotspots!) • Ground truthing of findings thru FGDs with communities
Sorsogon City CC Exposure/Scenario • Risk is Very High on combined risks to typhoons, drought caused by El Nino, projected rainfall change and projected temperature increase according to the DENR/Manila Observatory data
Sorsogon City CC Exposure/Scenario 1. Tropical Cyclones • The city is situated in the country’s geographical zone 6 where at least 3 cyclones every two years pass (PINCCC) • 2006 super typhoons Milenyo and Reming devastated the city
Sorsogon City CC Exposure/Scenario 2. Temperature Change : • 2-3 degrees centigrade increase in temperature 3. Increased Precipitation • 50% increase in annual rainfall 4. Sea Level Rise • Increasing trend in annual mean sea level occurred since 1970
HOTSPOTS Storm Surge & SLR Flooding Land Slide HOTSPOTS Sensitivity: City Hotspots
City Center Sensitivity to Tropical Cyclones/Storm Surge
Flooding Landslide City Center Sensitivity to Flooding and Land Slide
Urban and Urbanizing Barangays threatened with SLR City Center Sensitivity to Sea Level Rise
HOTSPOTS HOTSPOTS Findings, Implications and Challenges
Governance and Development Programming The land use plan must be revisited considering the projected risks were found in the built environment (hotspots). There are also hotspots in the Agricultural (Osiao and Sto. Nino) and Mangrove areas (Gimaloto). This would have implications on the existing city agri and environment programs. The city has not considered yet the risks areas and climate change impacts into its physical development planning. Data and information management needs to be developed (GIS, Knowledge Management) Findings, Implications and Challenges
Findings, Implications and Challenges Governance and Disaster Risk Management: • Need to strengthen CDCC and BDCC including coordination systems with the Provincial and Regional levels • Integration of climate change and DRM in the development planning of the City • Enhancing preparedness and mitigation
Findings, Implications and Challenges Governance and Institutional Coordination: • Given the complexities of City CC sensitivity, the different tiers of local government and other stakeholders need to improve coordination and collaboration mechanisms • Support of private sector (from within and outside the city) in Climate Risk Management is still very limited thus needs strengthening
Findings, Implications and Challenges • Settlements/Built-Up Area: • Most of the Hotspots are host to major commercial and residential areas • Total population in the hotspots is 41,257 where 35,621 is at the urban and urbanizing barangays • Informal settlers are located in the shorelines of the hotspots • Poverty Incidence: 43% • Given increased precipitation and flooding in some areas, urban slums are at high risk to climate related diseases and illnesses. • Limited knowledge on climate change was emphasized during FGDs with communities • A large number of housing structures in the hotspots are made of light materials while the protective community structure (sea wall) is aging, damaged, and needs repair
Current and Projected Vulnerabilities 36.6% 24% Vulnerable to flooding Vulnerable to multiple hazards 22,000+ women at risk
Findings, Implications and Challenges Economy and Productivity • Agriculture: 2,482 has. of rice paddies tilled by 3,313 farmers and 9,930 has. of coconut areas managed by 7,272 farmers are vulnerable to tropical cyclones • Following the sea level-rise scenarios of 0.5 m, 1.0 m of the IPCC as well as the 2.0 m worst case scenario, the downtown area where major commercial establishments are located would be affected by land inundation. • The tourism sector which is highly weather/climate dependent are facing risks. The revenues of beach resorts and the parks located in the coastal areas as well as the income of small traders and micro-entrepreneurs linked with tourism establishments would be affected.
Findings, Implications and Challenges Environmental Management and Climate Change Mitigation • The fishing communities’ adaptation to climate change impacts could be strained with the degradation of coastal and marine resources. • The forest cover of the city should still be improved as run-offs still causes floods. with heavier rainfalls and stronger typhoons due to climate change, the built environment is facing a great deal of risks from flash floods and erosion. This issue also limits carbon sequestration capabilities of the city. • Residential electricity users contribute the highest in the City Carbon emission profile (electricity and gas consumption). • The city is yet to fully operationalize it s SWM plan (controlled dumpsite issue)
City Emission Profile [1] Used the national power mix emission factor. http://www.klima.ph/resources/MO/08_LearningModules/ghg_calculator/primer/primer.html) *Assumptions: Average litres used/day = 2.2 litres/days; usage days/wk = 6.1 days/week; Unit usage per month = 53.69 litres; Unit gas usage/year 644.16 litres