Download
1 / 47
470 likes | 580 Vues
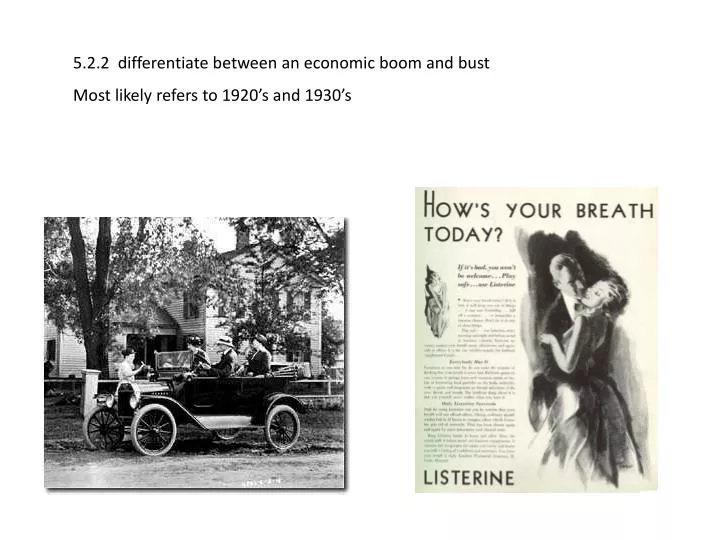
5.2.2 differentiate between an economic boom and bust Most likely refers to 1920’s and 1930’s. 5.2.2 differentiate between an economic boom and bust Most likely refers to 1920’s and 1930’s. JOBS! CONSUMERISM!. 5.2.2 differentiate between an economic boom and bust

E N D
5.2.2 differentiate between an economic boom and bust Most likely refers to 1920’s and 1930’s
5.2.2 differentiate between an economic boom and bust Most likely refers to 1920’s and 1930’s JOBS! CONSUMERISM!
5.2.2 differentiate between an economic boom and bust Most likely refers to 1920’s and 1930’s
5.2.2 differentiate between an economic boom and bust Most likely refers to 1920’s and 1930’s
5.2.2 differentiate between an economic boom and bust Most likely refers to 1920’s and 1930’s
5.2.3 recognize the concept of buying on credit Connects mainly to a cause of the Depression - Too much credit buying led to problems when production slowed down and people lost their jobs - couldn’t make payments on their Model T’s or new washing machines or homes.
5.2.4 interpret economic issues as expressed in maps, tables, diagrams, and charts (i.e., automobile sales, unemployment rates, or airplane production)
5.2.4 interpret economic issues as expressed in maps, tables, diagrams, and charts (i.e., automobile sales, unemployment rates, or airplane production) Great chart to duplicate - students can interpret. Why more cars in small towns than large cities? Why more radios in small towns than large cities? Why more phonographs and pianos in large cities than small towns? **Students must note the difference in reading a total number and reading a percentage. http://www.railsandtrails.com/AutoFacts/1927p38-100-8.jpg
5.2.4 interpret economic issues as expressed in maps, tables, diagrams, and charts (i.e., automobile sales, unemployment rates, or airplane production)
5.2.4 interpret economic issues as expressed in maps, tables, diagrams, and charts (i.e., automobile sales, unemployment rates, or airplane production)
5.2.5 analyze how environmental changes and crisis affected the economy across the nation in the 1930’s (i.e., Dust Bowl, Black Tuesday, Great Depression, Hoovervilles) http://www.tnhistoryforkids.org/students/5_history_5 Section on the Great Depression
5.2.5 analyze how environmental changes and crisis affected the economy across the nation in the 1930’s (i.e., Dust Bowl, Black Tuesday, Great Depression, Hoovervilles) http://drought.unl.edu/kids/impacts/dustbowl.htm Visuals, maps, graphs, even a video of the Dust Storms
5.2.5 analyze how environmental changes and crisis affected the economy across the nation in the 1930’s (i.e., Dust Bowl, Black Tuesday, Great Depression, Hoovervilles) http://pbskids.org/bigapplehistory/business/topic19.html http://www.time.com/time/nation/article/0,8599,1854569,00.html http://www.english.illinois.edu/maps/depression/photoessay.htm http://facts.randomhistory.com/2009/04/12_great-depression.html
5.2.5 analyze how environmental changes and crisis affected the economy across the nation in the 1930’s (i.e., Dust Bowl, Black Tuesday, Great Depression, Hoovervilles) "Black Tuesday" was the single most devastating financial day in the history of the New York Stock Exchange. Within the first few hours the stock market was open, prices collapsed and wiped out all the financial gains of the previous year. Since most Americans viewed the stock market as the chief indicator of the health of the American economy, the Great Crash shattered public confidence. Between October 29 and November 13, the day when stock prices hit their lowest point, over $30 billion disappeared from the American economy. This amount was comparable to the total amount of money that the federal government had spent to fight the First World War.
5.2.5 analyze how environmental changes and crisis affected the economy across the nation in the 1930’s (i.e., Dust Bowl, Black Tuesday, Great Depression, Hoovervilles) In the 1930s, Hoovervilles (shantytowns) formed coast to coast in cities of the United States. Some families were fortunate enough to stay with friends and family members that hadn't been evicted yet, but homeless men, women and children were forced to take up residence in shacks as a result of the Great Depression. Angry, cold and hungry Americans, who had no other place to reside, dubbed groups of those shacks in honor of President Herbert Hoover.
5.2.5 analyze how environmental changes and crisis affected the economy across the nation in the 1930’s (i.e., Dust Bowl, Black Tuesday, Great Depression, Hoovervilles) http://www.42explore2.com/depresn.htm Excellent summary of economic effects of the Great Depression Lots of linked websites
5.2.6 recognize how Americans used credit/installment plans to purchase consumer goods in the 1920’s (i.e., vacuum cleaners, washing machines, radios, and other home appliances) http://www.137.com/museum/enerad1.gif
5.2.6 recognize how Americans used credit/installment plans to purchase consumer goods in the 1920’s (i.e., vacuum cleaners, washing machines, radios, and other home appliances)
5.2.6 recognize how Americans used credit/installment plans to purchase consumer goods in the 1920’s (i.e., vacuum cleaners, washing machines, radios, and other home appliances) Two strategies that were used by advertisers to drive sales were largely targeted at stay-at-home wives. The first was the time-saving factor of new appliances. Advertisers appealed to housewives to free themselves from the drudgery of housework and have more leisure time by using mechanical devices to speed up labor-intensive tasks. The second was that savings in costs from using new and improved products would leave more disposable income which could then be spent on luxuries. Processed food advertisements also stressed the time saved in food preparation.
5.2.6 recognize how Americans used credit/installment plans to purchase consumer goods in the 1920’s (i.e., vacuum cleaners, washing machines, radios, and other home appliances) Installment credit soared during the 1920s. Banks offered the country's first home mortgages. Manufacturers of everything--from cars to irons--allowed consumers to pay "on time." About 60 percent of all furniture and 75 percent of all radios were purchased on installment plans. In contrast to a Victorian society that had placed a high premium on thrift and saving, the new consumer society emphasized spending and borrowing. A fundamental shift took place in the American economy during the 1920s. The nation's families spent a declining proportion of their income on necessities--food, clothing, and utilities--and an increasing share on appliances, recreation, and a host of new consumer products. As a result, older industries, such as textiles, railroads, and steel, declined, while newer industries, such as appliances, automobiles, aviation, chemicals, entertainment, and processed foods, surged ahead rapidly.
5.3.1 locate continents and significant bodies of water (I.e., Great Lakes; Atlantic, Arctic, Pacific oceans; Columbia, Missouri, Colorado, Rio Grande, Ohio, Tennessee, St. Lawrence, Mississippi rivers) http://www.worldatlas.com/webimage/testmaps/maps.htm
5.3.1 locate continents and significant bodies of water (I.e., Great Lakes; Atlantic, Arctic, Pacific oceans; Columbia, Missouri, Colorado, Rio Grande, Ohio, Tennessee, St. Lawrence, Mississippi rivers)
5.3.1 locate continents and significant bodies of water (I.e., Great Lakes; Atlantic, Arctic, Pacific oceans; Columbia, Missouri, Colorado, Rio Grande, Ohio, Tennessee, St. Lawrence, Mississippi rivers)
5.3.1 locate continents and significant bodies of water (I.e., Great Lakes; Atlantic, Arctic, Pacific oceans; Columbia, Missouri, Colorado, Rio Grande, Ohio, Tennessee, St. Lawrence, Mississippi rivers) http://www.worldatlas.com/webimage/countrys/nariv.htm Besides the map, also has brief descriptions of each river.
5.3.2 determine America’s population shifts by interpreting a population map
5.3.2 determine America’s population shifts by interpreting a population map http://www.lib.utexas.edu/maps The big shifts to concentrate on - 1890 census showed more urban than rural pop for the first time 1920’s - migration of black Americans to northern cities for jobs during and after WW I
5.3.3 locate information from an atlas entry https://www.cia.gov/library/publications/the-world-factbook/ http://www.onlineatlas.us/ http://go.hrw.com/atlas/norm_htm/world.htm
5.3.4 locate a major United States city using latitude and longitude http://www.worldatlas.com/aatlas/imageg.htm http://www.enchantedlearning.com/usa/statesbw/
5.3.6 locate the 50 states using a map with each state outlined.
5.3.7 recognize and compare landforms, climate, and natural resources of the three grand divisions of TN http://www.tnhistoryforkids.org/geography/e_4 An entire section on the 3 grand divisions Also see Grand Divisions resource activity in shared server!
5.4.1 distinguish between the local, state, and federal levels of the legislative, executive, and judicial branches of the American government.
5.4.2 select examples using illustrations of First Amendment freedoms (i.e., speech, assembly, and religion) Does “illustrations” mean pictures only??
5.4.3 recognize the rights established by the 13th, 14th, 15th, and 19th amendments
5.4.4 recognize the differences between the TN state constitution and the U.S. Constitution
5.4.5 differentiate among the purposes stated in the Declaration of Independence, the U.S. Constitution, and the Bill of Rights Declaration of Independence Listed “natural rights” of life, liberty, pursuit of happiness Purpose of government is to secure those rights for all Americans
5.4.5 differentiate among the purposes stated in the Declaration of Independence, the U.S. Constitution, and the Bill of Rights • U.S. Constitution - purposes are listed in the Preamble • Form a tighter union • Establish justice • Insure domestic tranquility • Provide for the common defense • Promote the general welfare • Secure the blessings of liberty for posterity
5.4.5 differentiate among the purposes stated in the Declaration of Independence, the U.S. Constitution, and the Bill of Rights Bill of Rights First 10 amendments Lists the individual freedoms of all Americans By putting them in written form, they would be clearly established
5.5.1 interpret sectional differences in the North and South in pre-Civil War (i.e., map of the Union, Confederate, and border states; pictorial representations of crop production; reading timelines; and interpreting bar graphs showing human, natural, and manmade resources.)
5.5.1 interpret sectional differences in the North and South in pre-Civil War (i.e., map of the Union, Confederate, and border states; pictorial representations of crop production; reading timelines; and interpreting bar graphs showing human, natural, and manmade resources.) http://mappinghistory.uoregon.edu/english/US/map16.html
5.5.1 interpret sectional differences in the North and South in pre-Civil War (i.e., map of the Union, Confederate, and border states; pictorial representations of crop production; reading timelines; and interpreting bar graphs showing human, natural, and manmade resources.)
5.5.1 interpret sectional differences in the North and South in pre-Civil War (i.e., map of the Union, Confederate, and border states; pictorial representations of crop production; reading timelines; and interpreting bar graphs showing human, natural, and manmade resources.) http://web000.greece.k12.ny.us/SocialStudiesResources/Social_Studies_Resources/SS_8_Documents/SS_8_Documents_06.05/UnionResources-2005.jpg
5.5.1 interpret sectional differences in the North and South in pre-Civil War (i.e., map of the Union, Confederate, and border states; pictorial representations of crop production; reading timelines; and interpreting bar graphs showing human, natural, and manmade resources.) http://web000.greece.k12.ny.us/SocialStudiesResources/Social_Studies_Resources/SS_8_Documents/SS_8_Documents_06.04/CivilWar-2004.jpg
5.5.1 interpret sectional differences in the North and South in pre-Civil War (i.e., map of the Union, Confederate, and border states; pictorial representations of crop production; reading timelines; and interpreting bar graphs showing human, natural, and manmade resources.)
5.5.1 interpret sectional differences in the North and South in pre-Civil War (i.e., map of the Union, Confederate, and border states; pictorial representations of crop production; reading timelines; and interpreting bar graphs showing human, natural, and manmade resources.) http://www2.lhric.org/pocantico/civilwar/graphs.htm - bar graphs by students http://www.teacheroz.com/Civil_War_Causes.htm - all kinds of info on Civil War to click and look over