Download
1 / 48
480 likes | 707 Vues
NBS-M009 Revision Session November 2010. Topics Covered in Module Carbon Reduction Commitment Building Regulations Code for Sustainable Homes Regulation in Electricity Supply Implications on Diversity of Supply Connection Charges and the Triad Demand Renewable Electricity Options

E N D
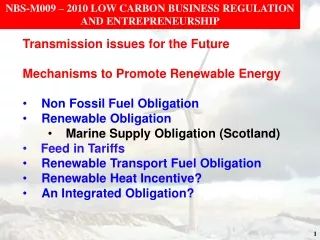
NBS-M009 Revision Session November 2010 Topics Covered in Module • Carbon Reduction Commitment • Building Regulations • Code for Sustainable Homes • Regulation in Electricity Supply • Implications on Diversity of Supply • Connection Charges and the Triad Demand • Renewable Electricity Options • The Renewable Obligation • Feed-in Tariffs • Other Topics • The Renewable Transport Fuel Obligation • The Future: Integrated Obligations?
Carbon Reduction Commitment Energy Efficiency Scheme - Changes since Comprehensive Spending Review Timing of phases has been changed Phase 1 is extended for an additional year - i.e. until 2013 – 2014 Phase 2 was originally to start in 2010 – 11 with qualification year 2010 – 2011, Footprint year 2011- 2012 and first compliance year 2012 – 2013 Original Timescale for Phase 1 Revised Timescale Phase 1 New Consultation Document – published 17th November 2010 Qualifying Year Footprint Year with Annual Report Compliance Year with Annual Report 2008 2013-14 2012-13 2012-13 2010-11 2010-11 2011-12 2011-12 R R 2008 R Registration Period Surrender of Allowances
Carbon Reduction Commitment Energy Efficiency Scheme - Changes since Comprehensive Spending Review Timing of phases has been changed Revised Phase 1 Phase 2 is delayed by 2 years – note change to Footprint Year Original Phase 2 Revised Timescale Phase 2 Qualifying Year Footprint Year No Report 2010-11 2013-14 2012-13 2013-14 2013-14 2011-12 2016-17 2017-18 2018-19 2015-16 2012-13 2010-11 2015-16 2014-15 2016-17 2017-18 2011-12 R R R 2012-13 2014-15 Registration Period R Footprint Year with Annual Report Compliance Year with Annual Report Surrender of Allowances
Carbon Reduction Commitment Energy Efficiency Scheme - Changes since Comprehensive Spending Review Subsequent Phases delayed by two years and will each last 7 years Last Phase (7) starts in 2038 and runs to for 5 years to 2043 By amalgamating Footprint and First Annual Reporting Year there will be one less reporting year in each Phase saving Removes requirement for those who fall just below threshold and do not have to register from making Information Disclosures – likely to affect ~ 15000 organisation.
Calculating Emissions to be included in CRC -EES Relevant Emissions Relevant Emissions Total Footprint Emissions Total Footprint Emissions Regulated Emissions CRC Emissions Regulated Emissions CRC Emissions MUST: remove emissions from exempted transport and onward Supply All Energy Use Emissions MUST: remove 100% of emissions covered by CCA exempt subsidiaries All Energy Use Emissions CAN: remove up to 10% of emissions, but not if measured by regulated meters or covered by CCA/ EU-ETS. MUST: account for at least 90% of emissions MUST: Remove all Emissions covered by CCA and EU-ETS
CRC-EES Purchase of Allowances: Phase 1 • During phase 1 and unlimited number of allowances will be issued, but there will be a cap on total emissions in Phase 2 and thereafter. • All Allowances will be purchased in April of relevant year at a FIXED cost of £12 per tonne • Additional allowances can be purchased in the Secondary Market from other participants (or traders) who have a surplus. • Additional allowances can also be purchased through the “Safety Valve System” which is analogous to the “Buy Out Prices” for ROCs
CRC – EES: Purchase of Allowances: • Banking Allowances • Allowances surplus to an organisations needs can be sold on the Secondary Market or banked against future years. • However, it is not possible to carry forward banked allowances between phases. • Operation of “Safety Valve” • AIM: To prevent price volatility in Secondary Market (as happened in Phase 1 of EU-ETS) • Participants pay a deposit equal to prevailing Safety Valve price in preceding month. • Government purchases extra allowances on EU-ETS and cancels same number of EU-ETS allowances. • Participants reimburse Government (or receive a rebate) for an difference between deposit price and actual price subject to a minimum price of £14 (revised upwards from £12 – February 2010)
CRC – EES: Purchase of Allowances: • In October’s Spending Review the UK Government announced that the CRC will be simplified to reduce the burden on businesses, with the first allowance sale for 2011/12 emissions now taking place in 2012 rather than 2011. • Revenue from the sale of CRC allowances, totalling £1 billion a year by 2014/15, will be used to support the public finances, including spending on the environment, rather than recycled to participants. • But what about registration payments etc. Will these still be paid??? • If 5000 organisations are involved this non-recycling will imply an effective tax averaging £200 000 per organisation per year
Issues relating to self generation of electricity CHP An organisation can claim credits for electricity exported to other organisations. Organisation does not declare own use of electricity An organisation cannot claim credits for exported heat as under CRC it is deemed to have zero emissions. - Could cause problems for District Heating Operations Renewable Generation – If no ROCs (FITs) are claimed then generation is treated as case with CHP If ROCs are claimed then electricity generated must be declared and emissions calculated as though it was grid imported – i.e. at a relatively high carbon factor – even though the generation would have a low factor – will affect UEA. Issue of geographic vs corporate emissions
LEAGUE TABLES under CRC - EES Relative Weighting of Phases As Phase 1 has been extended. What will be relative percentages in final year of that Phase?
Example of Performance Company A has emissions which decrease from 2000 to 1800 tonnes between years 1 and 2 of Phase 1 and at the same time output increases from £1500000 to £16000000. Company B has emissions which increase from 3000 to 3100 tonnes over the same period when the output increases from £2000000 to £2500000. How do the two companies compare with regards to the absolute and growth metrics?. • Company A performs much better with regard to absolute metric • Company B is better with regard to growth metric
Carbon Reduction Commitment – Energy Efficiency Scheme • Originally a new emissions trading system which will affect ~ 20 000 organisations in the UK – now a Taxation System. • ~ 5000 organisations will fully participate in trading, • remainder will only have to report emissions but may now be exempt from reporting following recent (Nov 2010 developments). • Criteria for inclusion is based on electricity use. • At least one Half-hour Meter (HHM) and • an annual consumption > 6000 MWh • [ annual consumption ~ equivalent to 1500 houses] • If an organisation satisfies first criterion then they merely have to report. • CRC split into Phases • Phase 1 (Introductory) will have a fixed price of CO2 allowances at £12 per tonne • Subsequent Phases will have a cap to limit emissions and allowances will be auctioned. Recent activity suggests that auctioning for Phase 2 may be reconsidered.
The Carbon Reduction Commitment Periods The CRC will be divided into phases, each of which will be 3 or more years Within each phase there will be: A qualification period, Organisations must assess whether or not they qualify to make an information disclosure or participate fully in CRC A registration period, Organisations must either submit their information disclosure or register as a participant with the administrator A footprint year, participants must monitor their total emissions from energy use. Note some emissions are excluded such as those already covered by EU-ETS etc. A series of compliance years, runs from April to March – now starting in April 2012, participating organisations must purchase allowances for each tonne of CO2 they emit, based on expected energy use, monitor their usage. 13
Financing the CRC - EES • Will there still be charges to Participants for all aspects of operation now that no money is to be recycled? Latest Consultation document does not address this question. • Original Proposed Charges
Electricity Security and Diversity Weekly fuel mix in electricity Generation11 - 17th January 2010 Mon Tues Wed Thurs Fri Sat Sun Notice higher proportion of coal used during day time hence a higher carbon emission factor.
Shannon – Wiener Index of Fuel Mix Diversity • Shannon – Wiener Index is a measure of diversity originally developed as a measure of biodiversity. • Higher index values occur with higher diversity. • But there is no absolute upper limit. • There is a maximum diversity index for a given number of items (e.g. species, fuels) when all items are in same proportion, but index will be higher for a greater number items. • Index is low if one item dominates Variation in maximum value of Index with number of items. The situation occurs when all items have equal proportion. e.g. with 6 fuel types the maximum value of index would be 1.8.
Shannon – Wiener Index of Fuel Mix Diversity • The Shannon-Weiner Index (H) is defined as: H = - pIlnpI where pi is the proportion of the ith item. The index value increases with number of items and also the relative proportions of items With three fuels, the maximum value reaches 1.09 when all the fuels are in equal proportions. In Norway where Hydro provides 99.5%, the index for the three fuels used is just 0.035.
Shannon – Wiener Index of Fuel Mix Diversity How has diversity of Electricity Generation in UK changed over last 30 years? Must evaluate fractional proportions: NOT percentages when using Shannon-Wiener Shannon – Wiener: H = - pI ln pI Shannon Wiener Factor has improved from 0.815 to 1.231 but is set to decline post 2015 with closure of coal and nuclear plant.
Demand Connection Charges 2010 - 2011 • Charges are made for Connections to the Transmission and distribution Grids. • For generators charge is in two parts • A charge per installed kW which varies across 20 charge zones ranging from >+£20 per kW to <-£5kW • A charge per kW according to local substation • For demand charge is made according to the TRIAD demand and as a Unit Charge The TRIAD occurs in the period 1st November – 28th/29th February It is the mean of the following: The maximum demand in any one half hour in the above time period. The second highest demand in any one half hour provided it is separated from (1) by at least 10 days. The third highest demand in any one half hour period provided that it is separated from (1) and (2) by at least 10 days
Demand Connection Charges 2010 - 2011 Subject to Revision on December 1st 2010
Demand Connection Charges - Example All Demand periods > 55 000 MW in the 2008 – 2009 TRIAD The TRIAD periods are shown in YELLOW. Note: there are periods when demand is higher than 15/12/2008 or 01/12/2008, but these are not separated by at least 10 days from principle TRIAD period on 06/01/2009 NOTE: TRIAD periods are almost always between period 34 and 36.
Demand Connection Charges - Example Typical Daily profile in December/ January for a company Note: one of the two daily peaks coincides with the peak TRIAD period 35. Explore shifting Process Time Cycle by 2 hours
Demand Connection Charges - Example After rescheduling Demand over TRIAD period reduces from 2040 to 1661 – i.e. by 379 MW If in South West, Saving in connection charge = 379 * 26.057832 = £9876
Generator Connection Charges under BETTA 1 2 3 4 6 A > £20 per kW 7 5 B 10 £15 to £20 per kW 8 C £10 to £15 per kW 9 11 D £5 to £10 per kW 13 12 E £0 to £5 per kW 14 15 F - £5 to £0 per kW 18 17 G 20 19 - £10 to -£5 per kW 16 24
Generation Connection Charges 2010 - 2011 In addition there is a local sub-station tariff which varies from as much as £4.79 per kW at Farr in the SHETL area to as little as -£0.60 per kW at Mark Hill in Ayrshire which was built specifically for a wind farm. These reflect the capabilities of the local regions around each substation Charges subject to possible amendment on 1st Dec 2010
Renewable Obligation Certificates Notifies OFGEM of compliance -i.e. ROCs or pays FINE Notifies Regulator how much generated. ROC’s issued FINES recycled in holders of ROCs in proportion to number held Sells Electricity with or without ROCs Supplier Buys ROCs from Trader Sells ROCs to Trader The Regulator OFGEM Renewable Generator SUPPLIERS Trader and Brokers Because of recycling, ROCs have value greater than their nominal face value
Example of estimation of total value of ROCs • Explain how the Renewable Obligation mechanism used in the UK works and how the value of renewable electricity may be estimated. [50%] • As company operating a 1.5 MW wind turbine which had a load factor of 27.63% during the period 1st April 2007 to 31st March 2008, estimate the total income you would have received from electricity sales using data given in Tables 1 and 2. • You may assume that any imbalance charges are compensated by embedded benefits.
Example of estimation of total value of ROCs Renewable Obligation ---- 25,551,357 MWh ROCs presented ---- 16,406,751 Shortfall in generation/ ROCs presented = 9084606 Value of Buy out Fund = 9084606 * £34.30 = £311 601 985.80 So Mark up value = 311601985/80 / 16406751 = £18.92 Total value of ROC = £34.30 + £18.92 = £53.22 Total value of Renewable Generation = £38.88 + £53.22 + £4.30 = £96.40 A 1.5 MW wind turbine @ 27.63% load factor generates 3630.582 MWh in year So total income = 3630.582 * £96.40 = £350 003.05
Renewable Obligation and Feed In Tariff Changes • Generators < 50 kW declare once a year under RO – will be mandatory to change to FIT from April 1st 2010 • Generators 50 kW – 5 MW will have option of a once only change from RO to FIT by a deadline • Generators > 5 MW remain in RO • RO is extended to 2037 subject to a maximum eligibility of 20 years. • Feed In Tariff will be banded and decremented year on year and will be fixed from inception of a project. It will run for a maximum of 20 years. • A small scale generator who uses electricity on site will benefit from: • A generation FIT, • An export FIT, • A reduced import of electricity
Feed in Tariffs – Introduced 1st April 2010 ***** for first 20000 installations
Feed in Tariffs – Export and Issue of Deeming Payment for tariffs will be from a levy on Utility Companies which MAY see a cumulative rise in bills of around £1 billion or more. In addition there will be a payment of 3p per kWh for any electricity exported as opposed to consumed on premises. BUT an export meter is needed to identify this. Householder will save on imported electricity at ~ 11 – 12p per kWh, so optimum financial model may not be to generate as much as possible i.e. for each unit generated and consumed it is worth 41.3+ 11 = 52.3p /kWh for each unit exported it is worth 41.3 + 3 = 44.3 p/kWh If no export meter is fitted – a transition arrangement of deeming that 50% of generation will be exported will be made - that may well not be as attractive to consumer. http://www.decc.gov.uk/en/content/cms/what_we_do/uk_supply/energy_mix/renewable/feedin_tariff/feedin_tariff.aspx
From the National Infra-Structure Plan 2010 following Comprehensive Spending Review • The Government will reform the electricity market, so that it attracts the private sector investment necessary to meet the UK’s energy security and climate change objectives, including the investment in nuclear, carbon capture and storage and renewable technology. • In addition to supporting the carbon price, this will also assess the role that revenue support mechanisms (such as Feed-In Tariffs), capacity mechanisms and emission performance standards could play. • For complete information see Section 4 of http://www.hm-treasury.gov.uk/d/nationalinfrastructureplan251010.pdf
From the National Infra-Structure Plan 2010 following Comprehensive Spending Review The Government will assess proposals against the criteria of cost-effectiveness, affordability and security of supply; • to ensure that regulation of national electricity networks enables the investment needed in transmission infrastructure to connect new low-carbon generation, such as nuclear power stations and offshore and onshore wind turbines; • maintain the Feed-In-Tariffs to support investment in emerging small-scale generation technologies in electricity, saving £40M by improving their efficiency, and complement this with the Renewable Heat Incentive to reward ground-source heat pumps and other renewable heat sources, while making efficiency savings of 20% by 2014-15 compared with the previous government’s plans. For complete information see Section 4 of http://www.hm-treasury.gov.uk/d/nationalinfrastructureplan251010.pdf
From the National Infra-Structure Plan 2010 following Comprehensive Spending Review The Government will (para 4.18): • Support investment in low carbon energy supply by: maintaining Feed-In Tariffs for small-scale generation, funded through an obligation on electricity suppliers equating to a levy of almost £900 million over the period to 2014-15. At the same time, the efficiency of Feed-In Tariffs will be improved at the next formal review [2012], rebalancing them in favour of more cost effective carbon abatement technologies. May be an issue for PV as carbon abatement using PV is around £700 per tonne saved way above many other strategies – see German Example Equivalent to £36 per household For complete information see Section 4 of http://www.hm-treasury.gov.uk/d/nationalinfrastructureplan251010.pdf
Changes in Electricity Supply Regulation • The Pool • NETA / BETTA • Deregulation • Changes in Company Ownership
Scottish Nuclear (Атомная)* Scottish Hydro Consumers Потребители Scottish Power Electricité de France PowerGen Licensed Suppliers Лицензированные поставщики Consumers Потребители The Pool Пул Independents-Независимые BNFL (Magnox) RECs Industry-Промышленность Second Tier Consumers Вторичные потребители Nuclear Electric * Eastern ** Innogy Scotland Шотландия England and Wales Англия и Уэльс 36
1250 MW Bid from company E £19.50 per MWh Bid from company D £19.40 per MWh 1250 MW Bid from company C £19.32 per MWh 32500 MW 1250 MW Bid from company B £19.31 per MWh 1250 MW 1250 MW Bid from company A £19.20 per MWh (0.96R / kWh) • Range of bids from companies in range £18 - £19 per MWh • 0.90 - 0.95 Roubles per kWh • Range of bids from companies in range £15 - £18 per MWh • 0.75 - 0.9 Roubles per kWh • Range of bids from companies in range <£15 per MWh • 0.75 Roubles per kWh System Marginal Price = £19.31 SMP 10000 MW 10000 MW Companies up to and including B successful 10000 MW £1 ~ 50 Roubles 37
Новая система оптовой торговли НЕТА How well has it performed since starting on 27th March 2001? UK becomes net importer of gas in 2004 Langeled and Balzand Pipe Lines completed Wholesale prices rose rapidly in 2004/2005, fell sharply from mid 2006, rose rapidly since mid 2007 then fell but are less stable. The weighted average wholesale price of 18th November 2010 was £43.27 although the peak price was £73.60 during period 34
The Balancing MechanismБалансирующий механизм Real Time 30 mins Current Day Текущий день Day Before День до Operation of Balancing Mechanism Балансирующий механизм Gate Closure Закрытие периода FPN IPN SummaryКраткое описание 3.5 hours 1 hour • Changes to contract position cannot be made after Gate Closure • Balancing Mechanism provides System Security • Изменения в позиции договора не могут быть внесены после закрытия периода • Балансирующий механизм обеспечивает безопасность функционирования Системы 39
The New Electricity Trading Arrangements Новая система оптовой торговли НЕТА Time OFFER FPN OFFER FPN Time The Balancing Mechanism Балансирующий механизм • To allow system to remain stable • Too little electricity on the system • Generators can OFFER to INCREASE output • Suppliers can OFFER to REDUCE consumption • If OFFER is agreed then Generators / Suppliers are PAID for any electricity increased / reduced under the OFFER. 40
The New Electricity Trading Arrangements Новая система оптовой торговли НЕТА Time OFFER FPN Bid OFFER FPN Bid Time The Balancing Mechanism Балансирующий механизм • Too much electricity on the system • Generators can BID to REDUCE output • Suppliers can BID to INCREASE consumption • If BID is agreed then Generators /Suppliers PAY for any reduction in generation / increase in demand under the BID. 41
50 - 100 MW: £50 per MWh (2.5 Roubles per kWh) 25 - 50 MW: £30 per MWh (1.5 Roubles per kWh) 0 - 25 MW: £20 per MWh (1 Rouble per kWh) FPN окончательная физическая нотификация Example of Differential Offers from a Generator The Balancing Mechanism Балансирующий механизм Generators / Suppliers may submit OFFERs or BIDs which differ for different levels of deviation from the Final Physical Notification National Grid Company normally accepts OFFERS / BIDS which are cheapest unless System Constraints prevent this. 42
The Balancing Mechanism Балансирующий механизм What happens if System Operator has got it wrong? OFFER / UNDO BID: Pair +2 OFFER / UNDO BID: Pair +1 FPN BID / UNDO OFFER: Pair -1 BID / UNDO OFFER: Pair -2 • OFFERs / BIDs cannot be cancelled • UNDO BID removes an OFFER and is usually less than the OFFER • UNDO OFFER removes a BID and is usually more than the BID • OFFERs / UNDO BIDs [ or BIDs / UNDO OFFERs] are submitted in pairs 43
Новая система оптовой торговли НЕТА Actual Metered Volume FPN Paid SSP FPN Actual Metered Volume Установлено в двустороннем порядке договаривающимися сторонами Settled bilaterally between contracting parties Pays SBP Установлено в двустороннем порядке между сторонами Settled bilaterally between parties Charges for imbalance depend on whether BM unit is deviating in same direction as overall system or not. Example shows cases where imbalance is in same direction as system Штрафные санкции за нарушение баланса зависят от того, отклонился ли субъект БМ в том же направлении, что и вся система, или нет Рисунок показывает случаи, когда нарушение баланса происходит в одном направлении с системой 44
Building Regulations – Topics covered • Review of Building Regulations in UK • Factors affecting energy consumption and carbon emissions • Standard Assessment Procedure • Approved Document AD1a - New domestic Properties • AD1b – New non-domestic Properties • AD2a - Existing domestic Properties • AD2b - Existing non-domestic Properties Other Topics Covered • Code for Sustainable Homes • Energy Performance Certificates • Introduction in Indian Building Regulations • Introduction to Chinese Building Regulations
Compliance to Building Regulations • Compliance to Building Regulations may be achieved by one of several alternative methods. • Elemental Method • Specifies maximum U-value and perhaps maximum glazed area – valid until 2002 Regs but with restrictions in 2002 • Target U-value – weighted average U-value allowed some flexibility in design – valid until 2002 Regs • SAP Rating (1994 Regs) – largely an economic assessment • Carbon Index (2002 Regs)* • Target Emission Rate (Current Regs)* • * SAP Procedure is use for these methods. SAP Rating is also calculated but it no longer a means of compliance.
Building Regulation: Compliance Summary Up to and including 2000 Regulations • Elemental Method – specifying U-values of fabric elements • Target U-Value – allowed some flexibility of design. • SAP Rating – an economic measure – only permitted for compliance in 1994 Regs. 2000/2002Regulations • Carbon Index Method- a distorted Carbon Measure 2005/6 Regulations • Dwelling Emission Rating must be better than Target Emission Rating. Latter is a derivative of the Target U-Value Method. 2009/10 Regulations • Retains DER and TER but expects a 25% improvement on performance over 2005/6 standards