Download
1 / 33
330 likes | 395 Vues
European Risk Model Comparison Study. Lawrence Houlden, Archon Environmental Consultants Ltd. Sponsors. Akzo Nobel BNFL BP Fortum ICI JM Bostad. Original Study Team. NICOLE Powergen SecondSite Property Shell Global Solutions Solvay TotalFinaElf. SKB, Netherlands Kemakta, Sweden

E N D
European Risk ModelComparison Study Lawrence Houlden, Archon Environmental Consultants Ltd
Sponsors Akzo Nobel BNFL BP Fortum ICI JM Bostad Original Study Team • NICOLE • Powergen • SecondSite Property • Shell Global Solutions • Solvay • TotalFinaElf • SKB, Netherlands • Kemakta, Sweden • UK Environment Agency • RIVM, Netherlands • VITO, Belgium Peer Review Team Research Contractor • Arcadis
Reasons for Study • Risk-based approach to land management common in Europe, but: • Many member states develop own models • Differences in model results can be orders of magnitude • Poor understanding of differences may undermine credibility of risk assessment • Study reported in 2003
Objectives • Compare human health risk models used in Europe to • Increase awareness/understanding of variability • Provide confidence in decision making • Compare model results to explain output differences - not to show which is better • Generic site with standardised inputs • Real test cases using model defaults • Determine whether fate and transport codes in models are conservative screening tools
Countries and Models • Austria Assessment Criteria; no model • Belgium (Flanders) Vlier-Humaan • Denmark JAGG update in progress • Finland 3-tier method, no model • France Method; no model • Germany UMS ; SISIM • Greece No model • Ireland No model • Italy Guiditta; ROME
Countries and Models (2) • Luxembourg No model • Netherlands HESP; SUS; Risc-Human • Norway SFT 99:06 • Portugal No model • Spain LUR (Basque Country) • Sweden Report 4639 • Switzerland TransSim (groundwater only) • UK Consim; P20; CLEA 2002 CLEA UK • Commercial RAM; RISC ; RBCA Toolkit
Selected Models • Belgium Vlier-Humaan • Denmark JAGG (no dose calculation; RPCs only) • Germany UMS • Italy ROME • Netherlands Risc-Human • Norway SFT 99:06 • UK P20 and CLEA • Commercial RISC and RBCA Toolkit
Methodology • Construct ‘generic’ site • Standardise inputs to extent possible • Generate receptor point concentrations, dose levels and human health risk outputs • Run sensitivity analyses • Run models on 5 real sites for some pathways • Accept model defaults (where reasonable) to show likely user-generated outputs
Outputs • Receptor point concentrations • Doses • Risk levels • Clean-up targets not an output because: • Requires assumptions on policy (acceptable risk, additivity) which often have no guidance • Some models (e.g. JAGG) compare receptor point concentrations to national quality standards
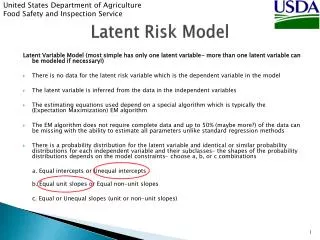
Cadmium Benzo(a)pyrene (BaP) Benzene Atrazine Trichloroethylene Soil Ingestion Dermal contact Vegetable ingestion Groundwater migration Indoor air inhalation Generic Scenario Findings Compounds Major Pathways
Soil Ingestion (Generic Site) Cadmium Relative Dose (normalised to Vlier-Humaan) Relative Dose
Soil Ingestion Models • All models have essentially the same soil ingestion algorithms • In Vlier-Humaan, exposure time and soil ingestion rate are not independent inputs • CLEA uses hard-wired probabilistic exposure at 95% level exposure 4x most models
Dermal Contact (Generic Site) BaP Relative Dose (normalised to Risc-Human) Relative Dose
Dermal Contact Models • CLEA has smaller dose as contaminant is allowed to volatilise as well as absorb • Vlier- & Risc-Human limits exposure to 2 hrs/day reflecting skin permeability (generic site has a daily ‘event’ with no time effect) • Risc-Human is very low because its soil-on-skin adherence is ‘hard-wired’ 10x lower than that in other models
Vegetable Ingestion (1) Relative Doses Normalised to RISC Relative Dose
Vegetable Models • Atrazine (threshold substance) results are similar due to use of similar algorithms • For non-threshold substances, doses from SFT:9906, Vlier- and Risc-Human higher due to not averaging doses over a 70-year lifetime • RISC is low because it uses a 1% US EPA-derived adjustment factor on Briggs root uptake equation • Vlier-Human: hard-wired parameters – fixed total impacted vegetables
Vegetable Models • UMS hardwires root:leaf ingestion at 85% leaf (vs. 50/50 in generic case). Leaf ingestion has higher uptake for lower Koc substances (e.g. benzene) • CLEA is low; six vegetable types and probabilistic dose dissimilar to other models & generic case; second term in Briggs-Ryan equation cannot exceed 1
Vegetable Models (2) • As (1), atrazine and cadmium results similar due to use of similar algorithms • Again, more variability in results of non-threshold substances due to averaging time differences • Cadmium relatively high in CLEA due to high BCF factor
Soil Source (mg/kg) Generic Site – Groundwater Scenario Receptors 50m Sand GW Source (mg/l) Plume Groundwater Pathway Sand
Groundwater Migration (Generic Case) TCE Concentrations (mg/l) in well at 50m GW Concentration (mg/l)
Groundwater Models • All models for generic site give concentrations within same order of magnitude • Most rely on Domenico steady state solution • JAGG results may not be comparable because it is limited to transport in one year (steady state may not be reached) • SFT:9906 gives lower numbers because it assumes the mixing zone increases with distance
Soil to Indoor Air Benzene concentrations in indoor air 46 Concentrations (mg/m3) 0.07 Note: UMS concentration is 650x higher than RBCA
Indoor Air – Soil Algorithms • RISC and RBCA both use Johnson & Ettinger • RISC has infinite source while RBCA has mass balance check (takes lowest value) • Both consider diffusion + advection via cracks • ROME has indoor air model but does not output air concentrations (only risks) • Considers diffusion only via cracks (infinite source)
Indoor Air – Soil Algorithms • Vlier- and Risc-Human use CSOIL algorithm • Diffusion only through pores (not cracks) in concrete foundation • UMS is most conservative, assuming indoor air is always 1% of soil gas concentration • JAGG uses concrete weathering algorithms for crack density (not straightforward) • SFT:9906 requires user to input soil vapour intrusion rate into building (difficult input)
Generic Site Conclusions • Soil ingestion and groundwater migration models are all similar (one order magnitude) • Vegetable ingestion model results surprisingly uniform (one order magnitude) • Dermal contact models more variable (two orders magnitude) • Indoor air models, particularly UMS code, have highest variability (3 orders magnitude) • Differences attributed to identifiable hard-wired parameters or algorithms (indoor air)
Test Site Cases • Lube plant: TCE plume in GW • Will show predicted vs. actual GW conc. • Manufactured gas plant - PAHs • Will show soil ingestion results vs. generic site • Fly ash landfill - heavy metals • Chemical plant with chlorinated solvents & pesticides in soil • Petrol filling station with BTEX & MTBE • Will show predicted vs. actual indoor air conc.
Test Site Cases • Models unconstrained: • Each model run using internal chemical/physical properties data where applicable • Model defaults chosen and therefore results should be more typical of those that a user would obtain. • Site-specific contaminant suite modelled
Soil Ingestion – Generic vs Test Site Relative Doses: BaP Soil Ingestion – Generic and Test Site No.2 750
Predicted vs. Actual GW Conc. Test Site 1: TCE concentrations at 57m with biodegradation TCE Concentration (mg/l) Note: Highest model default biodegradation rates used
Predicted vs. Actual Indoor Air Test Site 5: Vapour Concentrations in forecourt shop Concentrations (g/m3)
Test Site Conclusions • Groundwater migration concentrations closely approximated in specific test case, even without biodegradation (e.g. ROME) • Using model defaults (vs generic case) can lead to large differences, even for soil ingestion • Indoor air models with J&E algorithm closely match real BTEX data for specific test case
Overall Conclusions • Consistent defensible results possible where fate & transport / chemical parameters well understood • Where model defaults are used, significant differences (3 orders magnitude) can occur • Limited test sites indicate some models are conservative, but others more predictive Risk managers need to critically assess model assumptions & how software applied