Download
1 / 43
430 likes | 569 Vues
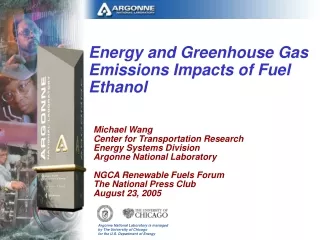
Fuel-Cycle Energy and Greenhouse Gas Emission Impacts of Fuel Ethanol. Michael Wang Center for Transportation Research Argonne National Laboratory Workshop on Economic and Environmental Impacts of Bio-Based Production Chicago, IL, June 8-9, 2004.

E N D
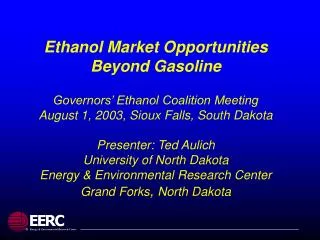
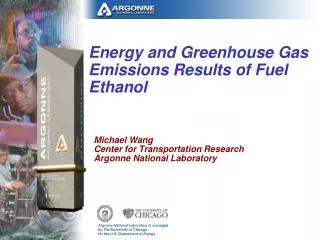
Fuel-Cycle Energy and Greenhouse Gas Emission Impacts of Fuel Ethanol Michael Wang Center for Transportation Research Argonne National Laboratory Workshop on Economic and Environmental Impacts of Bio-Based Production Chicago, IL, June 8-9, 2004
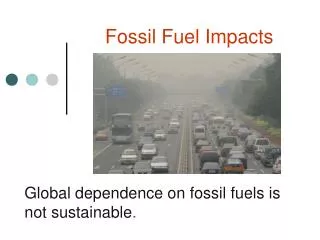
U.S. Now Consumes about 19 Million B/D of Oil, Transportation Accounts for ~75% Data sources: ORNL (2003), the Transportation Energy Databook; EIA (2003), Annual Energy Outlook; Annual Energy Review
North America Has Relatively Little Conventional Oil But 30% of Unconventional Oil Reserves
The Transportation Sector is the Second Largest U.S. GHG Emitting Source EPA (2003), Inventory of U.S. Greenhouse Gas Emissions and Sinks: 1990-2001
U.S. Has Had and Will Continue to Have the Highest Total GHG Emissions GAO (2003), Greenhouse Gas Emission Intensity
Reductions of Oil Use and GHG Emissions Could Be Major Goals for the U.S. Transportation Sector • Many ways have been studied and have potentials to reduce transportation oil use and GHG emissions • Advanced vehicle technologies • Hybrid electric vehicles • Fuel cell vehicles • New transportation fuels • Biofuels such as cellulosic ethanol • Non-petroleum fuels • Hydrogen produced from different energy sources, especially from renewable sources
Vehicle Cycle WTP: well-to-pump PTW: pump-to-wheels WTW: well-to-wheels (WTP + PTW) Fuel Cycle Pump to Wheels Well to Pump Cycles for Vehicle/Fuel SystemsThe Illustration is for Petroleum-Based Fuels
WTW Analysis Is a Complete Energy/Emissions Comparison As an example, greenhouse gases are illustrated here
The GREET (Greenhouse gases, Regulated Emissions, and Energy use in Transportation) Model • GREET includes emissions of greenhouse gases • CO2, CH4, and N2O • VOC, CO, and NOx as optional GHGs • GREET estimates emissions of five criteria pollutants • VOC, CO, NOx, PM10, and Sox • Total and urban emissions separately • GREET separates energy use into • All energy sources • Fossil fuels (petroleum, natural gas, and coal) • Petroleum • The GREET model and Its documents are available at http://greet.anl.gov; there are 1,200 registered GREET users
Biofuel Pathways and Fueled Vehicle Technology Options Currently in GREET Feedstock Farmed Woody and Herbaceous Biomass Corn Soybeans Fuel Prod. Technology Fermentation Transesterification Ethanol Fuel Biodiesel Oxygenated RFG: GVs Low-level blend (~E10): GVs High-level blend (~E85): FFVs and hybrids E100: FCVs (on-board reforming) Vehicle Technology Blend of BD10-BD50: CI engines CI hybrids
Additional Bio-fuel Production Pathways Are Being Added to GREET • Biomass gasification to produce • Ethanol • Methanol • FT diesel • Dimethyl ether • Hydrogen • Hydrogen production from reforming of ethanol and methanol at refueling stations
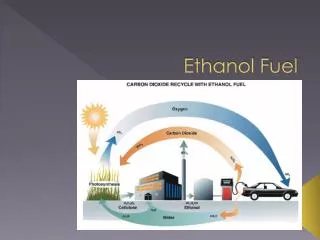
In 2003, the U.S. used 2.8 billion gallons of fuel ethanol U.S. Fuel Ethanol Use Has Increased Steadily Source: Renewable Fuels Association’s 2004 Ethanol Industry Outlook Report.
Energy Effects of Fuel Ethanol Have Been Subject to Debate • Some studies, especially those completed between late 1980s and early 1990s, concluded negative energy balance value of ethanol • Those past studies basically examined energy use of producing ethanol • Though self evaluation of ethanol’s energy balance is easy to understand, it may not be useful to fully understand true energy benefits of fuel ethanol • A more complete way is to compare fuel ethanol with the fuels to be displaced by ethanol (i.e., gasoline) • The GREET model has been applied to conduct a comparative analysis between ethanol and gasoline
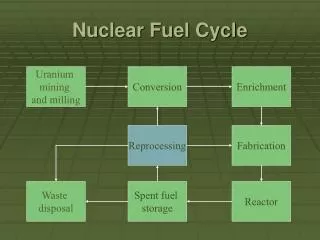
Ethanol Pathways Include Activities from Fertilizer to Ethanol at Stations Agro-Chemical Production Agro-Chemical Transport Corn Farming Woody Biomass Farming Herbaceous Biomass Farming Corn Transport Woody Biomass Transport Herbaceous Biomass Transport Ethanol Production Electricity (Cell. Ethanol) Animal Feed (Corn Ethanol) Transport, Storage, and Distribution of Ethanol Refueling Stations
0.65 0.60 0.55 0.50 Bushels/lb. Fertilizer 0.45 0.40 0.35 0.30 1965 1970 1975 1980 1985 1990 1995 2000 2005 U.S. Corn Output Per Pound of Fertilizer Used Has Risen (3-yr Moving Average) ? Some earlier studies showed negative energy balance for corn ethanol Precision farming, etc.? Source: from USDA data.
For Corn EtOH, N2O Emissions from Nitrogen Fertilizer Are a Key GHG Source • Some nitrogen fertilizer is converted into N2O and NOX via nitrification and denitrification in farmland • Depending on soil type and condition, 1-3% of N in nitrogen fertilizer is converted into N in N2O • On the well-to-wheels basis, N2O emissions from nitrogen fertilizers could account for up to 25% of total GHG emissions from corn ethanol
Technology Has Reduced Energy Use Intensity of Ethanol Plants Source: from Argonne’s discussions with ethanol plant designers and recent USDA data.
Well-to-Gate Energy and Emissions Allocated to Co-Products (Animal Feed) Vary by Allocation Method • Weight and energy methods no longer used • Some studies did not consider co-products at all
System Boundary Affects Results of Ethanol Greatly Ethanol Plant Materials and Construction Operation-Related Activities: Fertilizer, Farming, Farming Transportation Activities, Ethanol Production, Ethanol Transportation, Energy Use for Producing Process Fuels Food Intake by Farmers Farming Equipment Materials and Manufacture Solar Energy Embedded in Biomass
Energy Benefits of Fuel Ethanol Lie in Fossil Energy and Petroleum Use Uncertainty Range Energy for producing fuel Energy in fuel Energy Use for Each Btu of Fuel Used
Fossil Energy Ratio (FER) = energy in fuel/fossil energy input Increase in Energy Quality Energy in Different Fuels Can Have Very Different Qualities But, petroleum energy ratios for ethanol, coal, and electricity are much greater than one!!
Petroleum Refining Is the Key Energy Conversion Step for Gasoline Petroleum Recovery (97%) NG to MeOH Corn Petroleum Transport and Storage (99%) MTBE or EtOH for Gasoline Petroleum Refining to Gasoline (84.5-86%, Depending on Oxygenates and Reformulation) Transport, Storage, and Distribution of Gasoline (99.5%) WTP Overall Efficiency: 80% Gasoline at Refueling Stations
Key Issues for Simulating Petroleum Fuels • Beginning in 2004, gasoline sulfur content is reduced nationwide from the previous level of 150-300 ppm to 30 ppm • In addition, marginal crude has high sulfur content • New crude supply such as Canadian oil sands is energy intensive to recover and process • Desulfurization in petroleum refineries adds stress on refinery energy use and emissions • Ethanol could replace MTBE in RFG nationwide • Energy and emission differences in MTBE and ethanol • Differences in gasoline blend stocks for MTBE and ethanol
Changes in Energy Use Per Gallon of Ethanol Used (Relative to Gasoline)
Changes in Greenhouse Gas Emissions per Gallon of Ethanol Used (Relative to Gasoline)
Changes in Greenhouse Gas Emissions per Mile Driven (Relative to GVs)
Local Collection Long-Distance Transportation Local Distribution Rail Rail Refueling Stations Ethanol Plants Bulk Terminals Truck Terminals Barge Barge Truck Ocean Tanker Truck Transportation Logistics Could Affect Ethanol Energy and Emissions
Midwest Supply - Majority of Supply to California Oregon Terminals SF Bay Refineries Los Angeles Refineries Transportation of Midwest Ethanol to California is Accomplished via Rail and Ocean Based on Pat Perez of CEC.
Changes in Greenhouse Gas Emissions by Corn Ethanol: Midwest Use vs. California Use Results are based ethanol in E85
An Argonne Study Shows That Corn Ethanol in Diesel May Not Have GHG Benefits
Vehicle Fuel Economy Is One of the Most Important Factors for WTW Results Fuel economy ratios are relative to improved future gasoline ICE technology; On-road 55/45 MPG of baseline GV is assumed to be 27.5, a 22% improvement from 2000 MY midsize car MPG
A GM/ANL Study Takes the Following Key Assumptions for PTW Emissions 2010 MY Vehicle Emissions Targets Propulsion System Assumed Emission Performance Gasoline and E85 ICE Tier 2 Bin 5 Diesel and CNG ICE Tier 2 Bin 5, but no evap VOC Hydrogen ICE Tier 2 Bin 2, no evap, Bin 5 NOx Fuel processor fuel cell Tier 2 Bin 2 Hydrogen fuel cell Tier 2 Bin 1 (zero emissions) • Fuel consumption penalties of aftertreatment systems to meet standards were considered in the study • Bin 5 diesel has not been demonstrated • MY 2010 vehicle in-use emissions in 2016 were modeled using • EPA MOBILE 6.2 • ARB EMFAC2002 version 3
Vehicle/Fuel Technologies for WTW Energy and GHG Emission Results • Crude oil-based technologies RFG ICE LPG ICE LS Diesel ICE RFG ICE hybrid Gasoline FCV LS diesel ICE hybrid • Natural gas-based technologies FT diesel ICE CNG ICE FT diesel ICE hybrid MeOH FCV G.H2 FCV • Bioethanol and Electricity Corn E85 ICE FFV Cellulosic EtOH FCV U.S. average electri.-to-G.H2 FCV Renewable electricity-to-G.H2 FCV U.S. average electricity battery-powered EV
Vehicle/Fuel Technologies for WTW Criteria Pollutant Emission Results • Crude oil-based technologies RFG displacement on demand (DOD) SI conventional drive (CD) RFG DI SI CD LS Diesel DI CI CD RFG DOD SI hybrid LS diesel DI CI hybrid Gasoline fuel-processor (FP) FCV • Natural gas-based technologies CNG DOD SI CD FT diesel DI CI CD G.H2 SI CD MeOH FP FCV G.H2 FCV L.H2 FCV • Bioethanol and Electricity Corn E85 DOD SI CD Cellulosic E85 DOD SI CD Cellulosic EtOH FP FCV U.S. average electri.-to-G.H2 FCV NG CC electri.-to-G.H2 FCV Renewable electricity-to-G.H2 FCV 37
WTW Total Energy Use of Selected Vehicle/Fuel Systems Electricity and EtOH Natural gas feedstock Crude oil feedstock
WTW Fossil Energy Use of Selected Vehicle/Fuel Systems Crude oil feedstock Natural gas feedstock Electricity and EtOH
WTW GHG Emissions of Selected Vehicle/Fuel Systems Electricity and EtOH Crude oil feedstock Natural gas feedstock
Conclusions • Either corn or cellulosic ethanol helps substantially reduce transportation’s fossil energy and petroleum use • Ethanol’s energy balance alone has limited public policy information content • Corn-based fuel ethanol achieves moderate reductions in GHG emissions • Cellulosic ethanol will achieve much greater energy and GHG benefits
Outstanding Issues in WTW Analyses Need to Be Addressed Continuously • Multiple products • System expansion vs. allocation (GREET takes both) • System expansion: allocation vs. attribution of effects • Technology advancement over time • Current vs. future technologies – leveling comparison field • Static snap shot vs. dynamic simulations of evolving technologies and market penetration over time (a new GREET version conducts simulations over time) • Dealing with uncertainties • Stochastic analysis vs. conventional sensitivity analysis • Regional differences, e.g, CA vs. the rest of the U.S. • Trade-offs of impacts: value-driven? • WTW results may be better for identifying problems than for providing the answers