Download
1 / 25
250 likes | 370 Vues
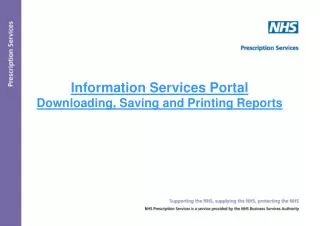
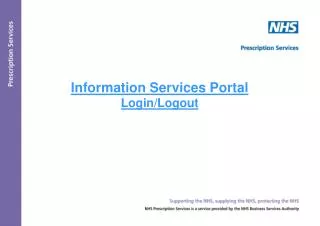
Information Services Portal Selecting and Viewing Reports. SELECTING AND VIEWING REPORTS. Information Services Portal Home Page. Select to reveal report categories. Important messages and latest news items will appear here under Broadcasts. 3.Select to reveal relevant Report Subcategories.

E N D
SELECTING AND VIEWING REPORTS Information Services Portal Home Page Select to reveal report categories Important messages and latest news items will appear here under Broadcasts
3.Select to reveal relevant Report Subcategories Select to exit and return to the homepage SELECTING AND VIEWING REPORTS Dispensing monitoring - this category will only show if you are an authorised user of MIS Reports
SELECTING AND VIEWING REPORTS The Report Category ‘QIPP’ is selected, revealing the reports available Select if you wish to exit and return to the homepage Select the desired report which will be revealed in a new window
SELECTING AND VIEWING REPORTS Once you have selected a report, a default chart of your organisation will be displayed in a new window
SELECTING AND VIEWING REPORTS Hovering over the bar in the chart with your mouse provides you with the organisation code and value
The chart provides the name of the report, data view, area and period SELECTING AND VIEWING REPORTS Tabs along the top allow you to select different aspects of the report Select to Bookmark Report Select for additional report information This provides a guide to the areas on the chart and shows the calculated ‘mean’
SELECTING AND VIEWING REPORTS Select to choose different organisational views and periods Select to filter out organisations Select to print report Select to highlight a specific area Select to download and choose download options Select to choose a view of the data included in the report Select to choose a graph view of the data Select to view the list of drugs within the report Select to view the PU Weightings
SELECTING AND VIEWING REPORTS Tabs turn black when selected which confirms your current view
SELECTING AND VIEWING REPORTS Tabs turn black when selected which confirms your current view
SELECTING AND VIEWING REPORTS The following is revealed when the ‘Drug List’ tab is selected Select a BNF code to drill down for further information
SELECTING AND VIEWING REPORTS You can select a BNF Code to drill down. The following is revealed if ‘ALL’ is selected Select to sort the Codes into numerical / alphabetic order Select to sort the Description into alphabetical order
SELECTING AND VIEWING REPORTS The following is revealed when the ‘PU Weightings’ tab is selected
SELECTING AND VIEWING REPORTSDATA SELECTOR Within the Data Selector you can choose different views of the selected report Under ‘Data View’ the drop down box reveals a selection of organisation views. The current view will be highlighted. Choose the view you require.
SELECTING AND VIEWING REPORTSDATA SELECTOR Select the period of data you wish to view. You can choose a financial year only or drill down further by selecting the ‘+’ sign to show quarters Options can be selected by clicking on a highlighted circle or by using the ‘+’ to drill down to more specific levels of data
SELECTING AND VIEWING REPORTSDATA SELECTOR Select the organisation you wish to view. You will also be given a choice to drill down to a more specific organisation depending on the selections made under ‘Data View’
SELECTING AND VIEWING REPORTSDATA SELECTOR Select the drop down box to change the PU Version
SELECTING AND VIEWING REPORTSDATA SELECTOR If you wish to cancel your selections choose ‘Reset’ Once all of your selections have been made choose ‘Get Report’ to update your report
SELECTING AND VIEWING REPORTSHIGHLIGHT Highlight allows you to choose an area you wish to stand out in the report Enter an Organisation you wish to search and highlight Or choose an area from the list
SELECTING AND VIEWING REPORTSHIGHLIGHT Selected area is highlighted in the report
SELECTING AND VIEWING REPORTSHIGHLIGHT Selected area is also highlighted under the data tab
SELECTING AND VIEWING REPORTSFILTER Filter allows you to remove an Organisation which may distort your data Untick the box next to the name of the organisation you wish to remove from your data. Click on Filter and report will refresh with the unticked organisation removed from the report and data view
SELECTING AND VIEWING REPORTSMIS REPORT Dispensing Monitoring (MIS Report) is restricted to authorised users only Select to reveal the MIS Report
SELECTING AND VIEWING REPORTSMIS REPORT Select to download the MIS Report for your PCT
SELECTING AND VIEWING REPORTSMIS REPORT The Data Selector tab allows you to choose the dispensing year / month you wish to view