Download

1 / 8

E N D
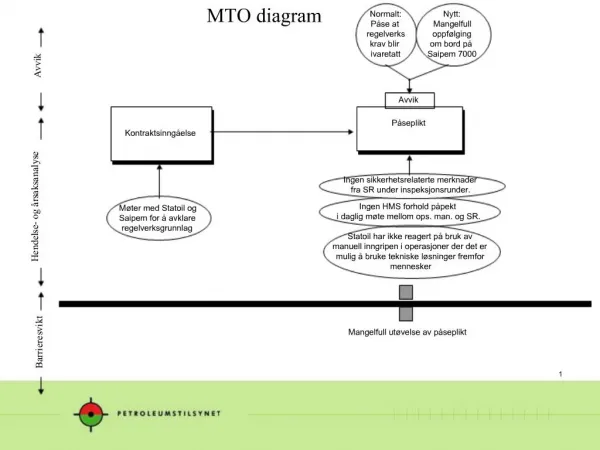
MTO TRAFFIC MODEL The following presentation contains references to Figures 6.02 and 6.03, Tables 6.01 and 6.04, all of which are posted under subsection 2.6 of the course notes on the instructor’s website. Viewer discretion is advised as some scenes contain material of a graphic, tabular and mathematical nature and are intended for mature audiences.
MTO TRAFFIC MODEL What does it do? Enables you to estimate the number of passes of a standard unit (ESAL) over a pavement during a specific design period. What information do you need? Analysis Period, Ap AADT in first year of Ap Annual Percent Traffic Growth Rate Number of Traffic Lanes & Directions Percent Trucks in Initial & Final Year of Ap
Total ESAL’s, Nf Over Analysis Period Final ESAL’s/day ESAL’s/day Average ESAL’s/day or DTN The MTO uses a trapezoidal representation of the total accumulated ESAL’s over the analysis period Nf is the area of the trapezoid = number of days in Ap x DTN Initial ESAL’s/day Time Analysis Period, Ap Initial Year Middle Year Final Year
Accumulated ESAL’s, N The MTO uses a parabolic model to determine the accumulated ESAL’s after Y years of the analysis period
The Equations Factor days out of equation 2
EXAMPLE The initial AADT for a 4-lane road is 12500 vpd and is expected to grow over the next 20 years at the rate of 3.5%/year. If the percent trucks is expected to increase from 10% initially to 15% at the end of the analysis period. Find the accumulated ESAL’s after 12years of traffic.
0.97 0.77 ? OK, now pull out your copy of Table 6.04 ? ? ? ? ? ?
? ? Bring it on home! ?