Download

1 / 46
460 likes | 472 Vues
Lab 5d SDS-PAGE. Electrophoresis. Separates molecules based on molecular mass and/or charge. Proteins move in the electric field. Their relative speed depends on the charge, size, and shape of the protein. What is so special about SDS?. SDS is a negatively charged detergent.

E N D
Electrophoresis • Separates molecules based on molecular mass and/or charge. Proteins move in the electric field. Their relative speed depends on the charge, size, and shape of the protein
What is so special about SDS? • SDS is a negatively charged detergent. • Disrupts secondary and tertiary protein structures by breaking hydrogen bonds and unfolding protein. • ‘Masks’ charge on protein so that all proteins act the same as regards charge. • Prevents protein aggregation. • Prevents protein shape from influencing gel run.
Uses of SDS-PAGE • Determine protein size • Identify protein • Determine sample purity • Identify existence of disulfide bonds • Quantify amounts of protein
Electrophoresis Electrophoresis is based on the migration of proteins in a charged field. The force moving the macromolecules is the electrical potential, E. µ = V/E, where µ is the electrophoretic mobility, and V is the velocity of the particle. µ = Z/f, where Z is the net charge of the molecule, and f is the frictional coefficient. f is related to the the shape of the molecule, as well as its size. Typically, the cross-linked polymer, polyacrylamide acts as the solid support. Normally, proteins would be separated in proportion to their charge-to mass ratio. The problem is that some proteins would migrate towards the anode, while others would migrate toward the cathode; and, the migration would not reflect size, but charge to mass. The trick is to carry out the electrophoresis in the presence of sodium docecyl sulfate, which is a detergent. SDS binds to every protein in roughly the same proportion, which is about one molecule for every two amino acid residues. SDS carries with it a negative charge, and the cumulative negative charge renders the intrinsic net charge of the protein insiginificant. Therefore, every protein will have the same charge to mass ratio, which will cause all proteins to migrate towards the cathode with a rathe that is dependent on their sizes. In contrast to gel-filtration, smaller molecules migrate faster than larger molecules Typically, this technique is not used to purify proteins, because SDS normally denatures proteins. It is used to analyze the purity of proteins.
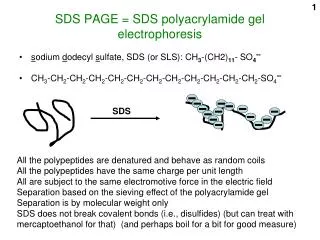
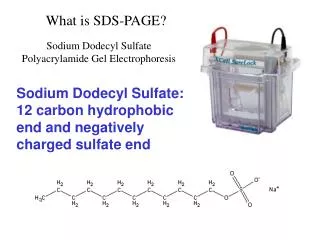
What is SDS-PAGE? SDS - Sodium Dodecyl Sulfate PAGE - Polyacrylamide Gel Electrophoresis Method commonly used in molecular biology for the separation of proteins. Determines the molecular weight of proteins and also approximates the length of a polypeptide. Gels after SDS-PAGE may be used in Coomassie staining technique Western blot 0
SDS-PAGE • SDS breaks up hydrophobic areas and coats proteins with negative charges thus overwhelming positive charges in the protein. • The detergent binds to hydrophobic regions in a constant ratio of about 1.4 g of SDS per gram of protein. • The end result has two important features: 1) all proteins contain only primary structure and 2) all proteins have a large negative charge which means they will all migrate towards the positive pole when placed in an electric field. • Before proteins are applied to the gel they are also exposed to a disulfide bond reducing agent, mercaptoethanol. The mercaptoethanol assists in protein denaturation by reducing all disulfide bonds.
Formation of Gel • Polyacrylamide gels are prepared by free radical polymerization of acrylamide and the cross linking agent N,N’-methylene-bis-acrylamide. Chemical polymerization is controlled by an initiator catalyst system, N,N,N’,N’-tetramethylethylenediamine (TEMED) • The copolymerization of acrylamide with methylenebisacrylamide produces a mesh-like network in three dimensions, consisting of acrylamide chains with interconnections formed from the methylenebisacrylamide.
SDS PAGE Movement • Tunnels Are formed in the PAGE Gel. • These Tunnels Vary In size and will separate the molecules when they travel through the gel.
Polyacrylamide Gel Two types of gel make up the SDS-PAGE method Separating Gel Separating gel has a higher pH (~8.8) and also has a higher concentraion of acrylamide for narrower pores. 10 % Separating gel contained acrylamide that was polymerized by TEMED to form the actual gel. TEMED is an agent used with ammonium persulfate to catalyze the polymerization reaction of acrylamide. Acrylamide in liquid form is a powerful neurotoxin that can be absorbed through the skin. Stacking Gel Slightly more acidic (~pH 6.8) and contains less acrylamide. Bigger pores. 0
Polyacrylamide Gel Cathode Anode Proteins separated by molecular weight
Stacking Gel • To obtain optimal resolution of proteins, a “stacking” gel is poured over the top of the “resolving” gel. • The stacking gel • lower concentration of acrylamide (larger pore size), • lower pH • different ionic content • This allows the proteins in a lane to be concentrated into a tight band before entering the running or resolving gel • produces a gel with tighter or better separated protein bands
Gels Polymerization, T%, C%
Procedures Prepare polyacrylamide gels (separating and stacking gels) Load protein samples into wells Run gel Analysis of results by staining with Coomassie blue or Western Blot 0
Setting Up a Vertical Gel Cathode Upper buffer Compartments Gel cassette Lower bufferCompartments Anode
The Electrophoresis Matrix • In gel electrophoresis the matrix forces sample components to separate by size, as they move through its porous structure. The matrix provides greater resistance to the movement of larger molecules. • the matrix serves as a solid medium upon which samples can be fixed and detected in post-electrophoretic analysis.
Fixing Proteins on Electrophoresis Gels • Most protein gels can be fixed effectively by soaking for 1 hr in 45% methanol, 45% water, and 10% glacial acetic acid. This solution is stable for up to 30 days at room temperature. A more stable fixative is 25% isopropanol, 65% water and 10% acetic acid, which can be stored at 4°C for up to 4 months.
Staining Proteins in Gels • Chemical stains detect proteins based on differential binding of the stain by the protein molecules and the gel matrix. They are nonspecific in action, detecting proteins without regard to their individual identities. The important characteristics for a useful stain are: low background, high sensitivity, large linear range and ease of use.
Protein visualization on gels Immediately after electrophoresis proteins in the gels are precipitated by either adding alcohol containing solutions or strong acids (e.g. TCA). Protein are often stained by Coomassie Blue dye or by photography-like treatment with AgNO3 (silver staining) There are many other stains available (e.g. Stains-all, fluorescence probes etc.)
Coomassie Stain Coomassie Brilliant Blue Stain 40% Methanol 0.125% Coomassie G-250 10% Acetic Acid Destaining Solution 40% Methanol 10% Acetic Acid Protocol After SDS-PAGE, the gel is transferred into a plastic container Coomassie staining solution was poured onto the gel, and it was incubated at room temperature for 2 hours with shaking. The gel was then destained with destaining buffer. Kimwipes were placed in the container to help absorbe the coomassie stain. After destaining, the gel was dried in drying film. 0
Example of Silver Stained Gel Silver staining is usually 10-100 times more sensitive than Coomassie Blue staining, but it is more complicated. Faint but still visible bands on this gel contain less than 0.5 ng of protein!
Molecular Weight Determination Shown above (on the left) is an SDS-polyacrylamide gel that has been stained with a dye in order to view the proteins. Lane one of the left figure represents a set of standards, while lane 2 represents a protein that has been purified. The molecular weight Mr of the protein can be estimated, by comparing its relative migration to that of the standards. The relation is that the relative migration is dependent on the log of the molecular weight.
2D-Electrophoresis 2D-electrophoresis allows separation of proteins by both size and isoelectric point. Each spot represents a different protein. The horizontal represents the isoelectric focusing direction, while the veritcal represents the SDS PAGE direction.
Protein Gel Electrophoresis • Native PAGE • Native Gradient PAGE • Urea PAGE • SDS PAGE • SDS Gradient PAGE • IEF • 2D PAGE • Western Blot
Native PAGE Separates folded proteins and protein-protein or protein-ligandcomplexes by charge, size, and shape • Useful for: • Examiningprotein-protein, protein-ligandinteractions • Detecting protein isoforms/conformers
Native PAGEExamples In the absence of phospholipids, bothtwinfilinsrun as a singlesharp band on this gel. PI(4,5)P2 causes twinfilin-1 and twinfilin-2 to movemorerapidlytoward the anode, indicating a netincrease in the negative charge and thus a binding interaction. Dimerization of KIR2DL1 in the presence of Co2 Qing R. Fan et al. JBC 2000 Vartiainenet al. JBC 2003
Native Gradient PAGE Separate native proteins by size – proteins stop movingwhentheyreach acertaingel density (but this maytake a verylong time ...) A great technique to studyprotienoligomerization!
Native Gradient PAGEExample Native 4-15% gradient PAGE Zavialov et al. Mol. Microbiol. 2002
Urea PAGE Separates denatured proteins by size/charge Typically 6-8 M urea is added into the gel A great technique to study protein modifications!
Example of Urea PAGE Urea PAGE of samples of heat shock protein 25 Zavialov et al. BBA1998
SDS PAGE Due to high density of binding of SDS to proteins, the ratio size/charge is nearly the same for many SDS denatured proteins. Hence proteins are separated only by length of their polypeptide chains (but not by differences in charge). Great separation. Allows estimation of the size of polypeptide chains
SDS Gradient PAGE 12.5% SDS PAGE Bands in SDS gradient gel are usually sharper than in homogeneous SDS PAGE 5-20% SDS PAGE
IsoelectricFocusing Separates proteins by their isoelectric points (pI) Each protein has own pI = pH at which the protein has equal amount of positive and negative charges (the net charge is zero)
IsoelectricFocusing Mixtures of ampholytes, small amphoteric molecules with high buffering capacity near their pI, are used to generate the pH gradient. Positively and negatively charged proteins move to – and +, respectively, until they reach pI. PI of proteins can be theoretically predicted. Therefore, IEF can also be used for protein identification.
IsoelectricFocusing IEF 4-6.5 pH gradient
2D PAGE Lung V79 cells from chinese hamster
Western Blotting (WB) WB is a protein detection technique that combines the separation power of SDS PAGE together with high recognition specificity of antibodies An antibody against the target protein could be purified from serum of animals (mice, rabbits, goats) immunized with this protein Alternatively, if protein contains a commonly used tag or epitope, an antibody against the tag/epitope could be purchase from a commercial source (e.g. anti-6 His antibody)
WB: 4 Steps • Separation of proteins using SDS PAGE • 2. Transfer of the proteins onto e.g. a nitrocellulose membrane (blotting) • 3. Immune reactions • 4. Visualization
Look at it on a gel. A monomer should have one band. Calculate the specific activity by doing a careful quantitative assay for enzyme activity/total protein. Standards | Crude Ext.| Pooled fractions Assess purity – screen 2 Purification Table • Results: • Gel shows one band • Specific activity is 15000. • Looks good Your protein seems pure. YOU’RE DONE!!!.
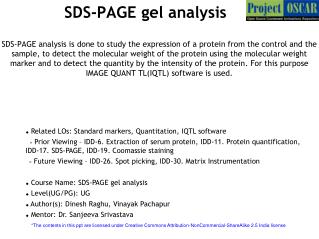
Applications SDS-PAGE Isolation of protein Approximating the length of a polypeptide Determining the molecular weight of protein bands 0
Logarithmic scale graph • Trendline is exponential, but on this type of graph it appears linear
Requirement for Report • Measure all the distance that protein spots travel, and convert the distance to corresponding relative mobility • Tabulate all the distances, relative mobility. • Graph the relative mobility vs log MW • Estimate the molecular weight of protein spots in F1, F2, and F3 and compare their relative intensity