Download
1 / 18
180 likes | 657 Vues
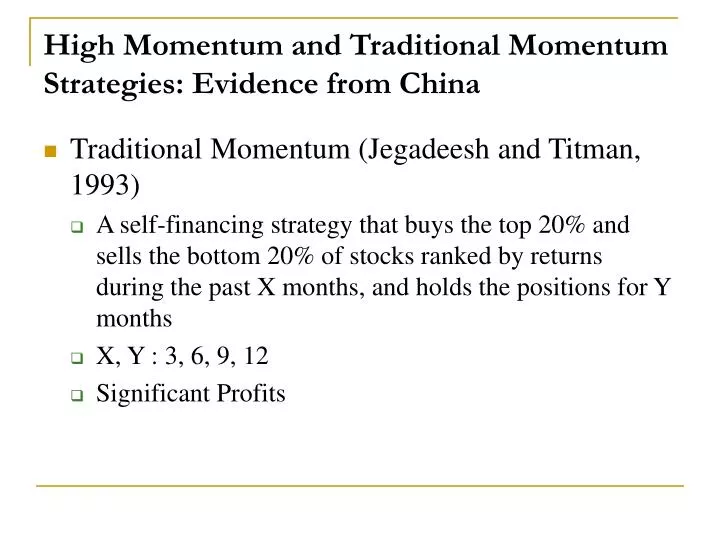
High Momentum and Traditional Momentum Strategies: Evidence from China. Traditional Momentum (Jegadeesh and Titman, 1993) A self-financing strategy that buys the top 20% and sells the bottom 20% of stocks ranked by returns during the past X months, and holds the positions for Y months

E N D
High Momentum and Traditional Momentum Strategies: Evidence from China • Traditional Momentum (Jegadeesh and Titman, 1993) • A self-financing strategy that buys the top 20% and sells the bottom 20% of stocks ranked by returns during the past X months, and holds the positions for Y months • X, Y : 3, 6, 9, 12 • Significant Profits
Traditional momentum strategy, (X,Y) (JT, 1993) t Formation Period: X months Holding Period: Y months These portfolios are equally weighted. The strategy is to hold, for Y months, a self-financing portfolio that is long the winner and short the loser portfolios At the beginning of each month t, stocks are ranked in ascending order according to past return of past X months. Stocks ranked in the top 20% constitute the winner portfolio, stocks in bottom 20% constitute the loser portfolio,
Literature • 52-week (12-month) high momentum (George and Hwang, 2004) • A self-financing strategy that buys the top 20% and sells the bottom 20% of stocks ranked by the nearness of stock price to its 12-month highest price, and holds the positions for 6 months • Nearness to the 52-week high is a better predictor of future returns than are past returns • Nearness to the 52-week high has predictive power whether or not stocks have experienced extreme past returns • Considering investor behavioral bias
X-month high momentum strategy, (X,Y) (GH, 2004) t Formation Period: X months Holding Period: Y months These portfolios are equally weighted. The strategy is to hold, for Y months, a self-financing portfolio that is long the winner and short the loser portfolios At the beginning of each month t, stocks are ranked in ascending order according to nearness ratio based on past X months highest price. Stocks ranked in the top 20% constitute the winner portfolio, stocks in bottom 20% constitute the loser portfolio,
Stock Price Highest Price: Pt* Nearness Ratio: Pt/Pt* Formation Period t Time
Motivation • Out-of-sample Test and new evidence from China • Why studying China Stock Market? • Large proportion of individual investors with short investment horizon • Underdeveloped institutional investors prior to 2003 • Poor transparency of information disclosure • Frequent and Inconsistent regulatory changes
Motivation • George and Hwang (2004) • 52-week high is most readily available to investors • Virtually every newspaper that publishes stock prices also identifies the stocks that hit 52-week highs and lows • Why are 52-week? • How about 26-week high, or 12-week high?
Motivation • The evidences of traditional momentum in China’s stock market are mixed • Kang, Liu and Ni (2002) • Momentum strategy with formation and holding periods of 16, 20, or 26 weeks are significantly profitable • Wang (2004) • Momentum strategy with formation and holding periods less than 26 weeks are insignificantly profitable • Comparison between traditional momentum and 52-week high momentum
Main Issues • The profitability of the 52-Week High Momentum Strategy in China market • Robustness for formation and holding period • Comparison between traditional momentum and 52-week high momentum
Major Findings • The 52-week high momentum is more profitable in China market than US market. • The profitability of x-month high momentum is robust for 6, 9, 12 months formation and holding period • Separation between traditional momentum and 52-week high momentum
Data and Methodology • Center for China Economic Research (CCER) Database • Sample Period: January1994 to June 2003 • Methodology: JT (1993) and GH (2004).
Empirical Results • The average monthly return for 52-week high momentum strategy in China’s stock market is 0.84% (t=2.62), which is more significant than that in the U.S. market with an average return of 0.45% (t=2.00).
Empirical Results • Traditional Momentum strategy • Insignificant average return
Empirical Results • X-month high Momentum strategy • Significant average return 52-week high momentum strategy
Empirical Results • No seasonal pattern • The abnormal return can not be explained by market model, the Fama and French 3-factor model, or the characteristic model based on size and book-to-market ratio.
Empirical Results • 52-week high distance: the number of days from the highest price to the end of month t • The closer the highest point, the weaker the profits of the strategy
Conclusion • The average monthly return for 52-week high momentum strategy in China’s stock market is 0.84% , which is more significant than that in the U.S. market • China has 52-week high momentum but no traditional momentum. • There are some new evidences related to 52-week high momentum strategy